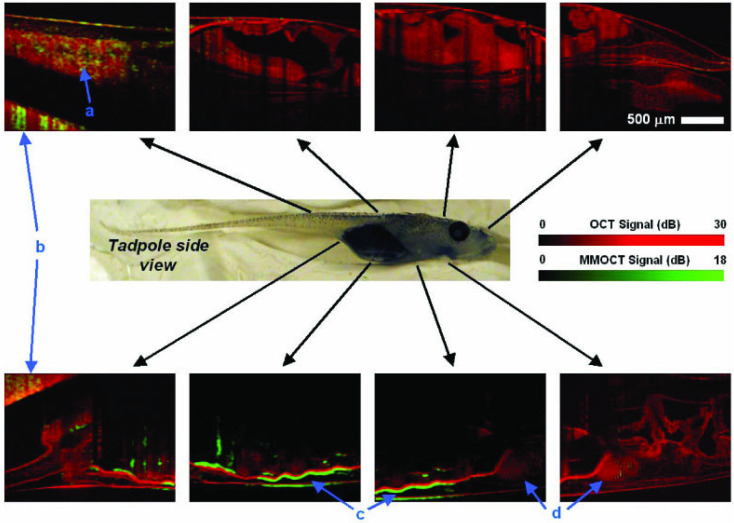
Figure 3.
In vivo MM-OCT imaging of magnetic nanoparticles in a Xenopus tadpole model fed with magnetic nanoparticles. Red colormaps represent the structural (no contrast) OCT and the overlaid green signals represent magneto-motive contrast enhanced OCT. Blue arrows with letter identifiers indicate the tail, clay imaging holder, intestines, and heart, respectively. MNPs were primarily observed in the intestines (c). Reproduced with permission from 32. Copyright 2005, Optica Publishing Group.

