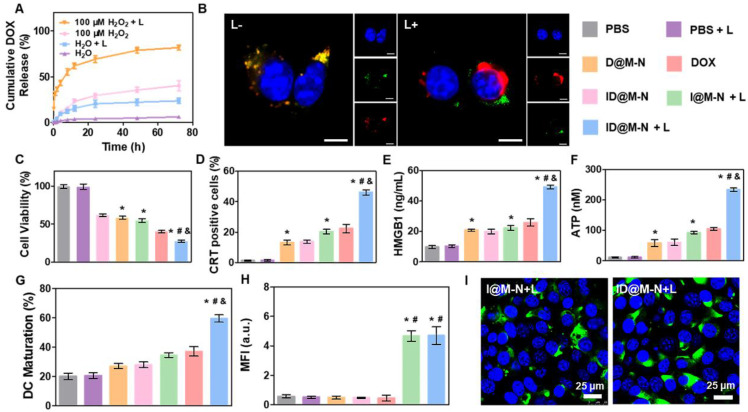
Figure 3.
Drug release and therapy in vitro. (A) Drug release profiles under different conditions. (B) CLSM images of core-shell dissociation process of ID@M-N in 4T1 cells. Blue: nucleus, green: FITC-labeled shell layer of ID@M-N, red: DOX loading core of ID@M-N; scale bars: 10 µm. (C) In vitro cytotoxicity of different preparations (DOX: 3 µg mL-1, ID@M-N: 10.1 µg mL-1) on 4T1 cells after incubation for 1 day. (D) CRT-positive cells and (E) released HMGB1 and (F) ATP levels of 4T1 cells after 24 h exposure of different formulations. (G) Percentage of mature DCs (CD11c+CD80+CD86+) after co-incubation with different treated 4T1 cells. *, #, & P < 0.05 compared with the PBS (*), D@N-N (#), and I@M-N+L (&). (H) The mean fluorescence intensity (MFI) and (I) CLSM images of HSP70 expression on 4T1 cells after treated with different formulation. Blue: nucleus; green: HSP70 scale bars: 25 µm. *, # P < 0.05 compared with the PBS (*), D@N-N (#). All data are mean ± SD (n = 3).

