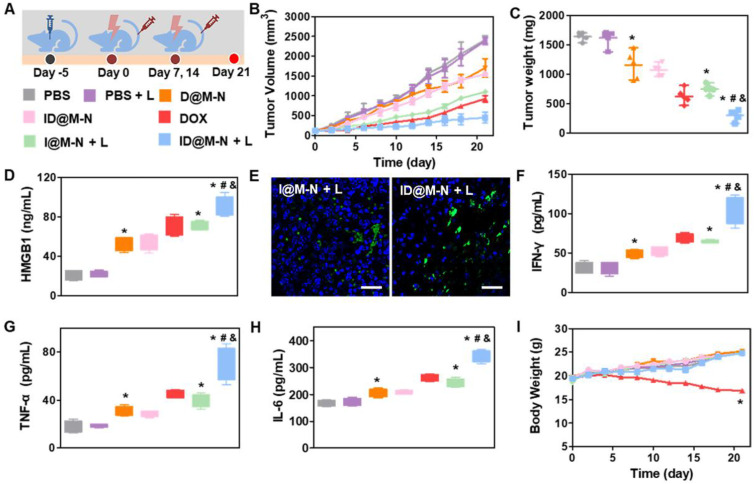
Figure 5.
Chemotherapy and anti-tumor immunologic response in vivo. (A) Schematic treatment schedule. Mice were randomly divided into seven groups (n = 5): (1) PBS, (2) PBS+L, (3) D@M-N, (4) ID@M-N, (5) DOX, (6) I@M-N+L, (7) ID@M-N+L. (B) Tumor growth curves and (C) tumor weight. (D) Tumoral HMGB1 levels in each group. (E) CLSM images of HSP70 expression in 4T1 tumor. Blue: nucleus; green: HSP70; scale bar: 25 µm. (F) IFN-γ, (G) TNF-α, (H) IL-6 levels in serum after treatment. *, #, & P < 0.05 compared with the PBS (*), D@N-N (#), and I@M-N+L (&). (I) Body weight of mice in each group. All data are mean ± SD (n = 5). *P < 0.05 compared with the PBS (*).

