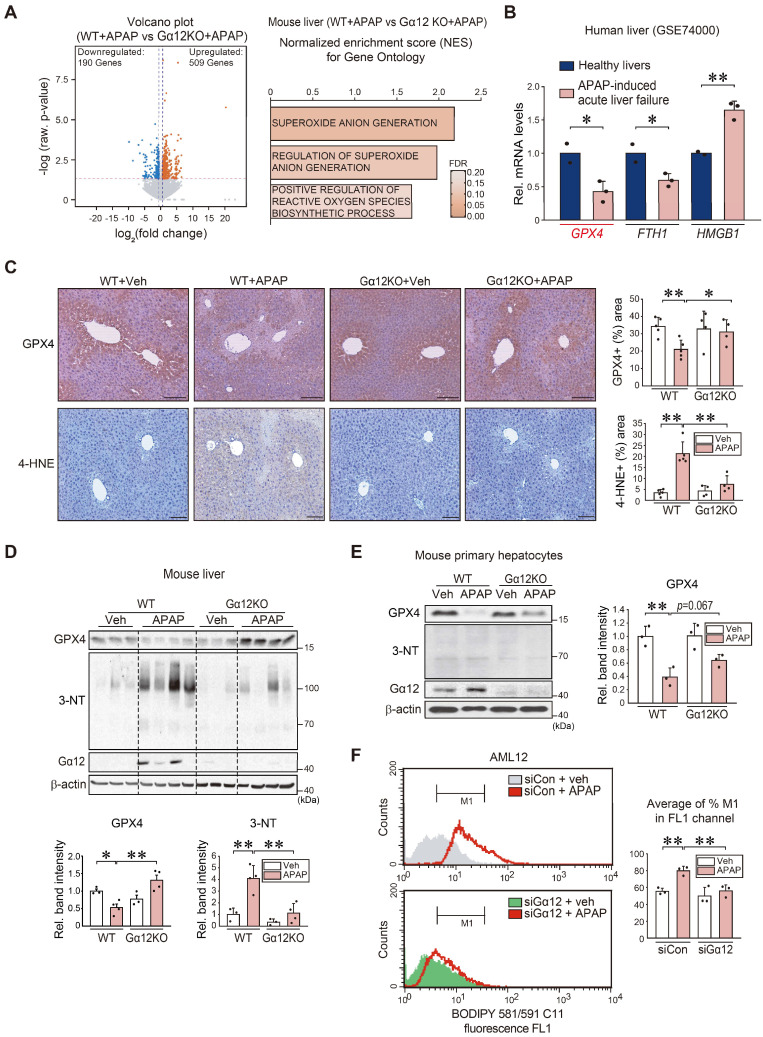
Figure 3.
Hepatocyte ferroptosis mediated by Gα12-dependent peroxidation upon APAP exposure. (A) Volcano plot representation of differentially expressed genes between APAP-treated WT and Gna12 KO mice using RNA-seq analysis. The horizontal and vertical lines indicate the filtering criteria (absolute fold-change ≥ 1.5 and raw P < 0.05). The red and blue dots indicate the upregulated (509 genes) or downregulated (190 genes) genes (left, n = 3 each). GO terms associated with ROS production were obtained between WT and Gna12 KO mice treated with APAP (300 mg/kg BW, 6 h) (right, n = 3 each). NES and FDR are shown in the bar graph. (B) GPX4, FTH1, and HMGB1 transcript levels in patients with acute liver failure. Hepatic transcripts levels were assessed using a publicly available dataset (GSE74000) from healthy individuals (normal) or patients with APAP-induced acute liver failure (n = 2 or 3 each). (C) Immunohistochemistry for GPX4 and 4-HNE (scale bar: 200 μm). Percent areas of GPX4 and 4-HNE staining were assessed in the livers of WT or Gna12 KO mice treated with APAP (300 mg/kg BW, 6 h) using the Image J program (n = 4 or 5 each). (D) Immunoblottings for GPX4, 3-NT, and Gα12 in the livers of the same mice as in C. The band intensities represent values relative to their respective control (n = 3 or 4 each). (E) Immunoblottings for GPX4, 3-NT, and Gα12 in WT or Gna12 KO primary hepatocytes treated with APAP (10 mM, 12 h). The band intensities represent values relative to the respective controls (n = 3 each). (F) Histograms of BODIPY 581/591 C11 fluorescence at a 530 nm emission wavelength (FL1 channel) in AML12 cells treated with vehicle or APAP (10 mM, 24 h) after transfection with siCon or siGα12 (100 nM each, 24 h; the experiments were simultaneously performed). Averages of M1 proportion (%) in the FL1 channel were also measured (n = 3 each). For B-F, values were expressed as mean ± SD (*P < 0.05, **P < 0.01). Statistical significance was tested via two-tailed Student's t-tests or one-way ANOVA coupled with Tukey's HSD or the LSD multiple comparison procedure, where appropriate.

