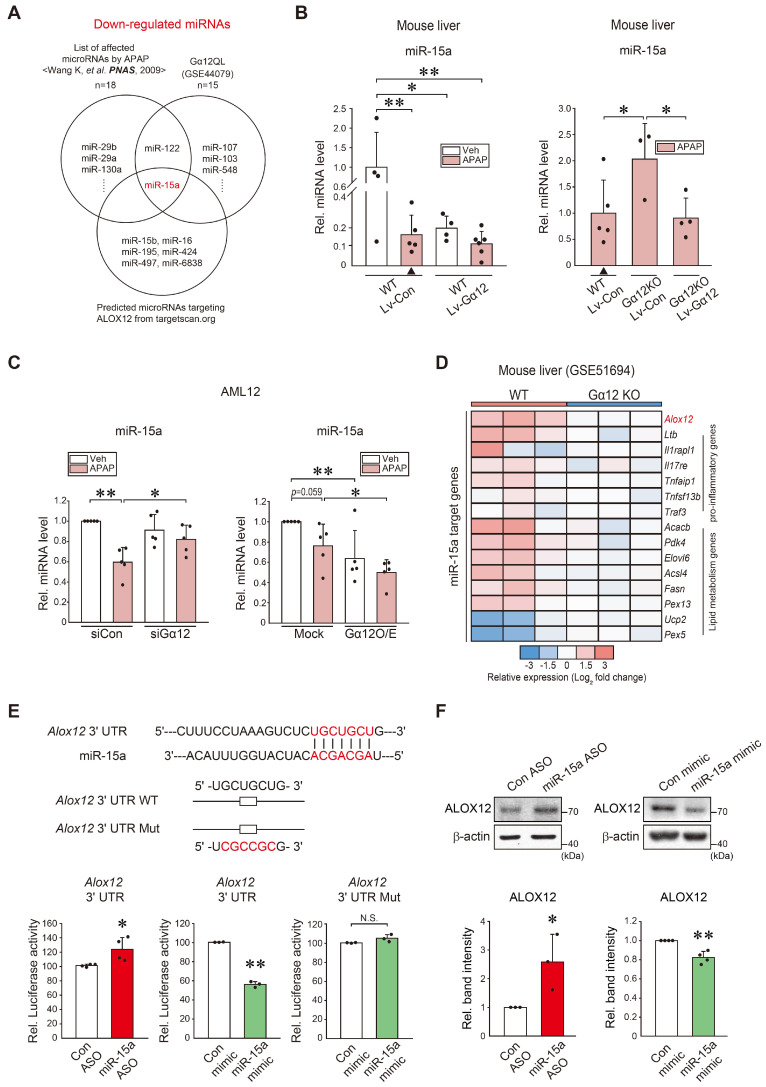
Figure 5.
Identification of miR-15a as an inhibitor of ALOX12 downstream from Gα12. (A) Venn diagrams showing miR-15a expression among the downregulated miRNAs in the liver of mice treated with APAP (300 mg/kg, 24 h) (Wang K, et al. PNAS, 2009), Huh7 cells with Gα12QL transfection (GSE44079), and those predicted to inhibit ALOX12 based on our Target Scan database analyses; 18 miRNAs were downregulated in the first set, whereas a total of 15 downregulated miRNAs were identified in the second set. Seven miRNAs were predicted to target ALOX12. (B) qRT-PCR assays for miR-15a using the same mice as in Fig. 4G (n = 4-6 each) or Fig. 4H (n = 3-5 each). Experiments were done at the same time and the marked control group (▲) was shared for statistical analysis. (C) qRT-PCR assays for miR-15a in AML12 cells treated with APAP (10 mM, 12 h) after transfection with siGα12 (or siCon) (100 nM, 24 h, n = 5 each) (left), or the plasmid encoding for Gα12 or a mock vector (1 μg, 24 h, n = 5 each) (right). (D) Heatmap of differentially expressed miR-15a target genes based on the GSE51694 dataset from the livers of WT and Gna12 KO mice; Alox12, 6 pro-inflammatory genes, and 8 lipid metabolism genes (n = 3 each). (E) Prediction of miR-15a binding to the 3'-UTR of Alox12 mRNA (upper). Alox12-3'-UTR luciferase assays in AML12 cells transfected with miR-15a ASO (or control ASO) (100 nM, 48 h), or miR-15a mimic (or control mimic) (100 nM, 24 h) (lower, n = 3 or 4 each). (F) Immunoblottings for ALOX12 in AML12 cells transfected with miR-15a ASO (or control ASO) (100 nM, 48 h), or miR-15a mimic (or control mimic) (upper, 100 nM, 24 h). The densitometric band intensities represent values relative to the respective control (lower, n = 3 or 4 each). For B, C, E, and F, values were expressed as mean ± SD (*P < 0.05, **P < 0.01). Statistical significance was tested via two-tailed Student's t-tests or one-way ANOVA with the LSD multiple comparison procedure, where appropriate.

