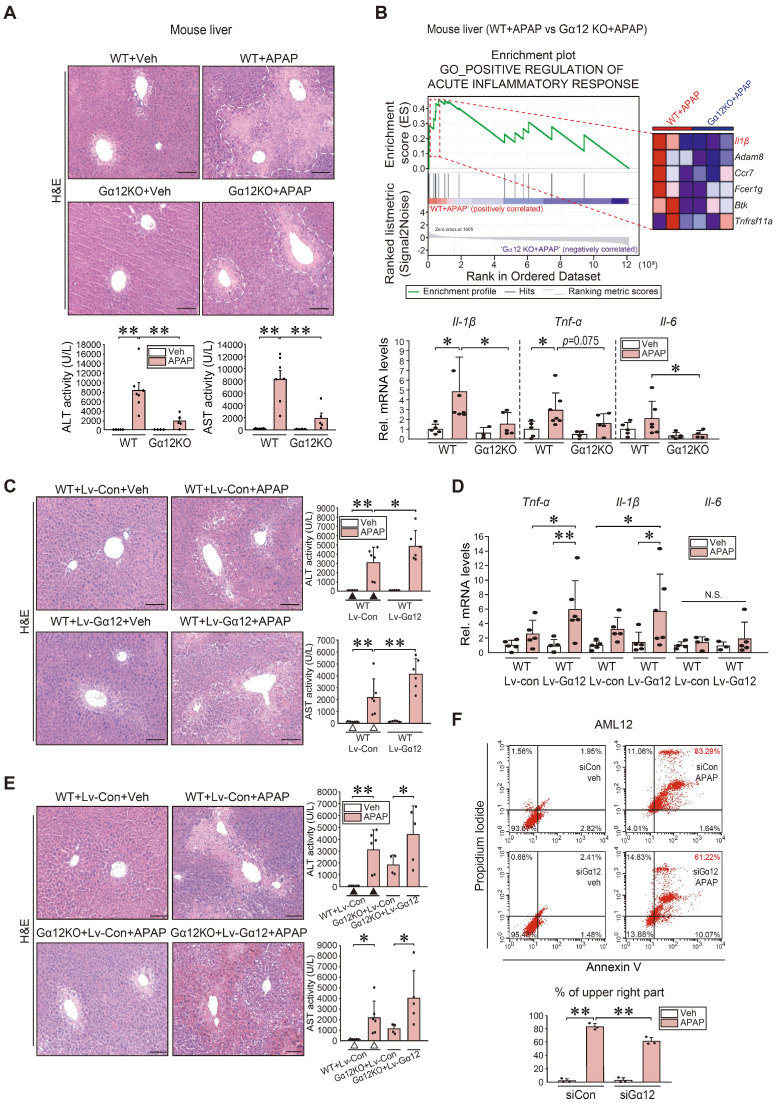
Figure 7.
Increase in inflammatory injuries of hepatocytes by Gα12 overexpression. (A) Liver histopathology (H&E), serum alanine transaminase (ALT), and serum aspartate transaminase (AST) activities in WT or Gna12 KO mice treated with APAP (300 mg/kg BW, 6 h) (n = 4-7 each). (B) GSEA plot of GO categories, leading-edge genes (upper, n = 3 each) (NES = 1.94, FDR < 0.1), and qRT-PCR assays in the same mice as in A (lower, n = 3-7 each). (C) Liver histopathology, ALT, and AST activities in the same mice as in Fig. 4G (n = 5 or 6 each). (D) qRT-PCR assays for inflammatory cytokines in the same mice as in Fig. 4G (n = 3-6 each). (E) Liver histopathology (left), ALT and AST activities (right) in the same mice as in Fig. 4H. For C and E, experiments were done at the same time and the marked control groups (▲ and △) were respectively shared for statistical analyses. (F) Flow cytometric analyses for fluorescein isothiocyanate-annexin V and propidium iodide (upper). The average proportion (%) of the upper right portion was measured (lower). AML12 cells were treated with APAP (10 mM, 24 h) after transfection with siCon or siGα12 (100 nM each, 24 h) (n = 3 each). For A-F, values represent the mean ± SD (*P < 0.05, **P < 0.01). Statistical significance was tested via one-way ANOVA coupled with Tukey's HSD or the LSD multiple comparison procedure, where appropriate. scale bar: 100 μm.

