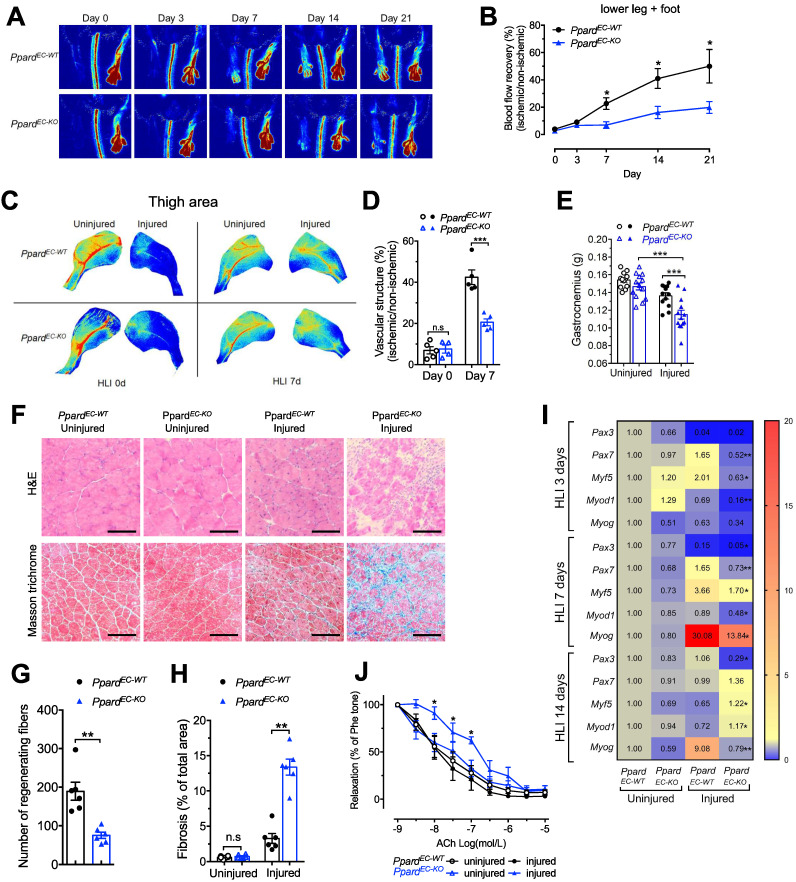
Figure 1.
Endothelial deletion of Ppard impairs vascular remodelling and damages skeletal muscle regeneration. Perfusion imaging following HLI, showed in representative images (A) and analysis in (B) (n = 6 mice for each group). C-D, Representative images of Vasculature imaging in leg area were recorded at days 0 and 7 in representative images (C) and summarized analysis in (D) (n = 5, each group). E, Muscle weights of gastrocnemius (GA) were measured at days 14 after HLI. F, Haematoxylin/eosin staining (up) and Masson trichrome staining (bottom) at days 14 after HLI (n = 6, each group). Scale bar, 100 μm. G, Quantification of regenerating muscle fibers based on H&E staining. H, Quantification of fibrosis (blue colour) based on trichrome staining. I, Heatmap of qPCR data at days 3, 7, 14 after HLI. The number in each cell represents the fold change compared with PpardEC-WT uninjured GA (n = 5-6, each group). Results are means ± SEM. J, Concentration-response curves to acetylcholine (ACh) in femoral arteries at days 28 after HLI. Results are means ± SEM. * p < 0.05, ** p < 0.01, *** p < 0.001 between groups or vs injured PpardEC-WT. Student's t test was used for comparison between two samples, and one-way ANOVA and multiple comparison test was used for more than two samples.

