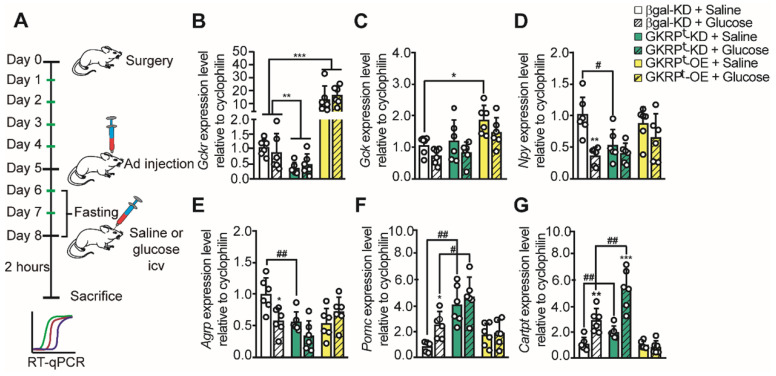
Fig 6.
Neuropeptide expression profile in response to glucose in rats with loss and gain of GKRP function. According to the protocol in A, the expression of GKRP (B), GK (C), NPY (D), AgRP (E), POMC (F), and CART (G) mRNA was evaluated in fasted rats after 72 h transduction and 2 h of saline or glucose icv injection. n = 6 per condition. * p < 0.05, ** p < 0.01, *** p < 0.001, saline injection versus glucose. # represents an equivalent value of p but comparing saline or glucose with respect to the same condition in the control group.

