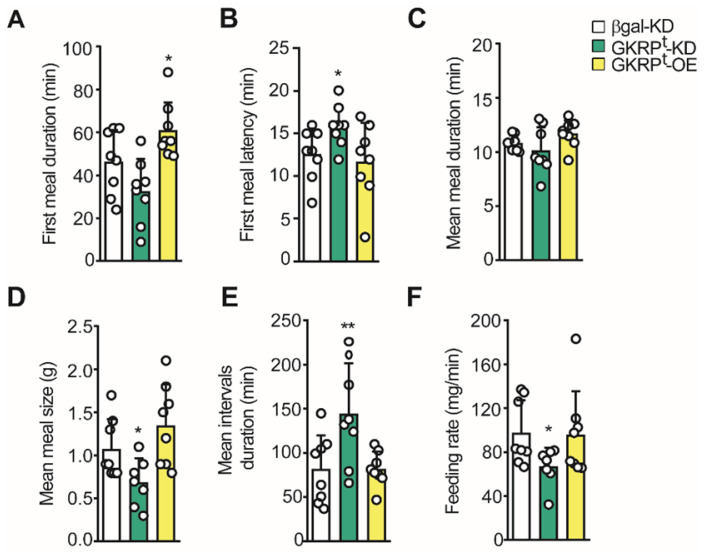
Fig 8.
Microstructure of feeding in GKRP KD and overexpressing rats. A. Average duration of the first feeding event. B. Delay time (latency) at the beginning of the feeding after presenting the food. C. Mean duration of each feeding event. D. Mean meal size calculated as cumulative intake/number of feeding events. E. Mean duration of inter-meal intervals. F. Mean feeding rate in each experimental group. n = 8 per condition. * p < 0.05, ** p < 0.01.

