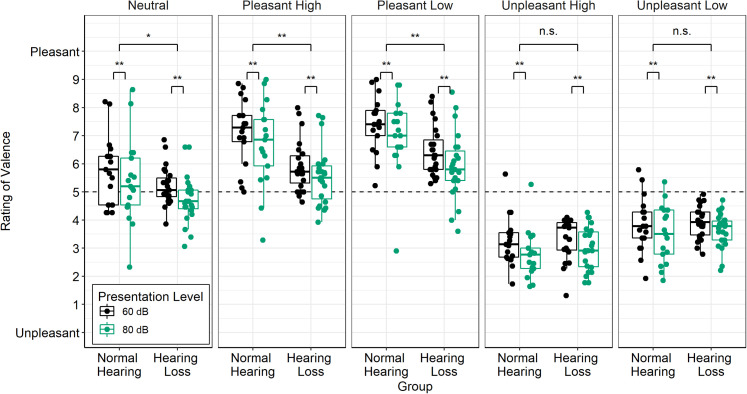
Figure 2.
Mean Ratings of Valence for Participants With Normal Hearing and Hearing Loss in the Two Conditions Without Hearing Aids (60 and 80 dBA). Ratings have been averaged across sounds within each category for each participant. Boxes represent first to third quartile; solid lines indicate median; circles indicate data from individual participants. Significant differences are indicated by *p < .05 or **p < .01. NS = nonsignificant comparison.

