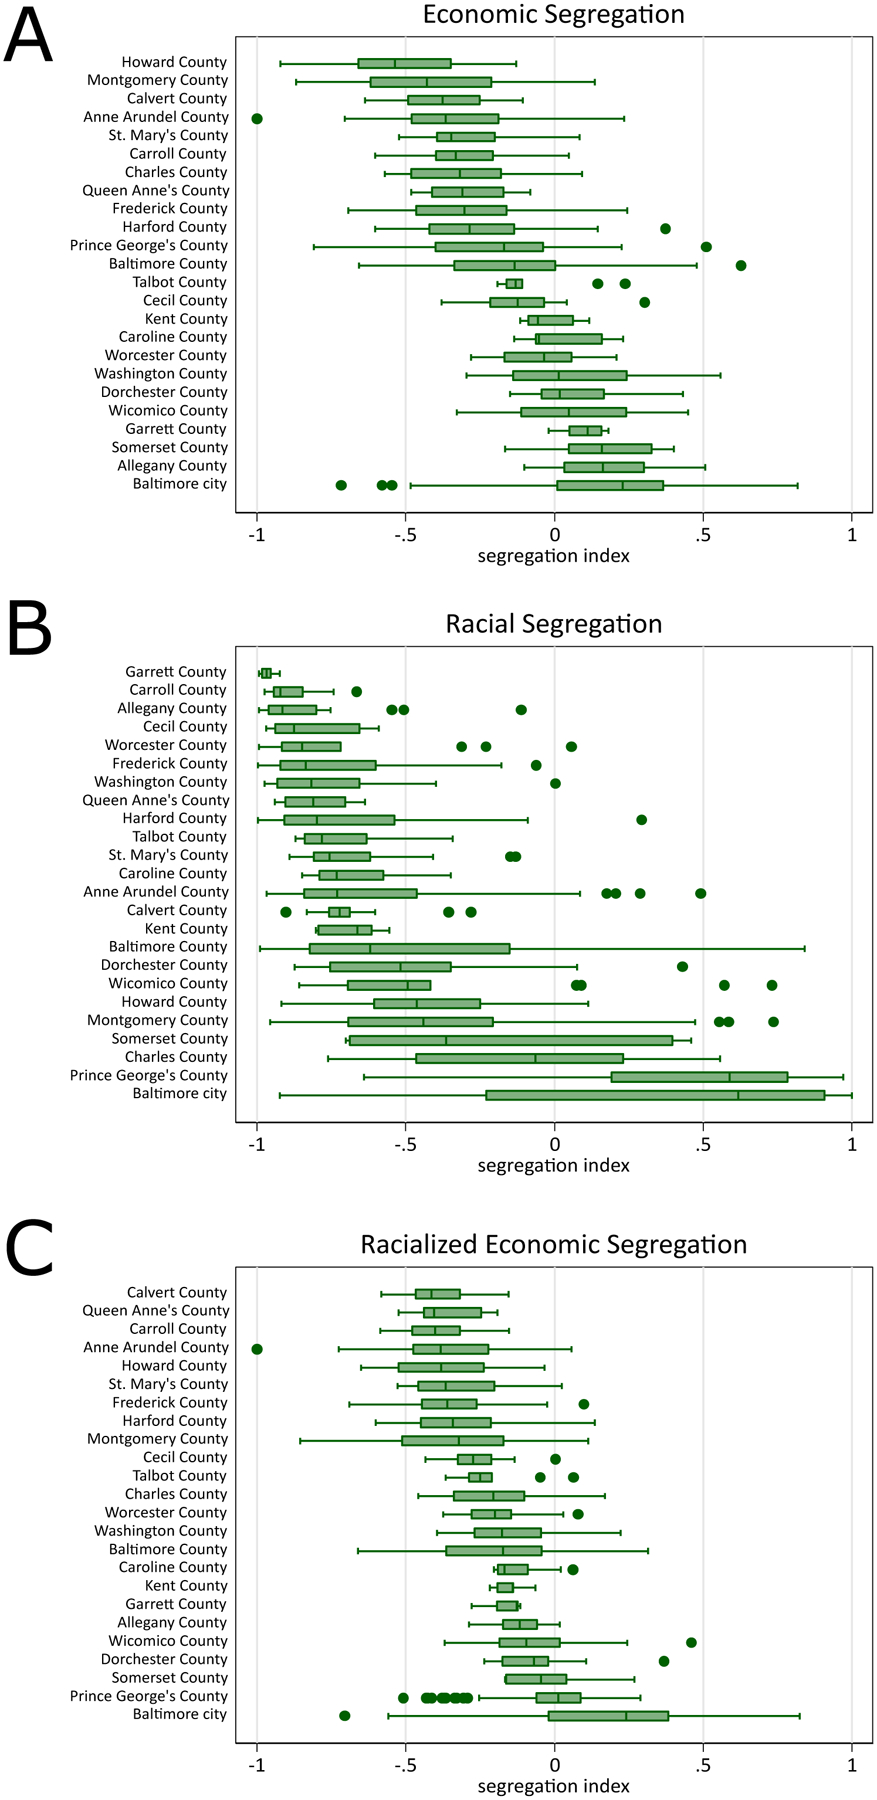
Figure 1.

Distribution of economic and Black-White racial segregation indices by county in Maryland based on the American Community Survey, 2011–2015
Panel A: For economic segregation, a value towards −1 indicates higher concentration of high-income households (i.e., higher economic privilege) and a value towards 1 indicates higher concentration of low-income households (i.e., lower economic privilege.
Panel B: For racial segregation, a value of towards −1 indicates higher concentration of White households (i.e., higher racial privilege) and a value towards 1 indicates higher concentration of Black households (i.e., lower racial privilege).
Panel C: For racialized economic segregation, a value of towards −1 indicates higher concentration of high-income White households (i.e., higher racialized economic privilege) and a value towards 1 indicates higher concentration of low-income Black households (i.e., lower racialized economic privilege).
