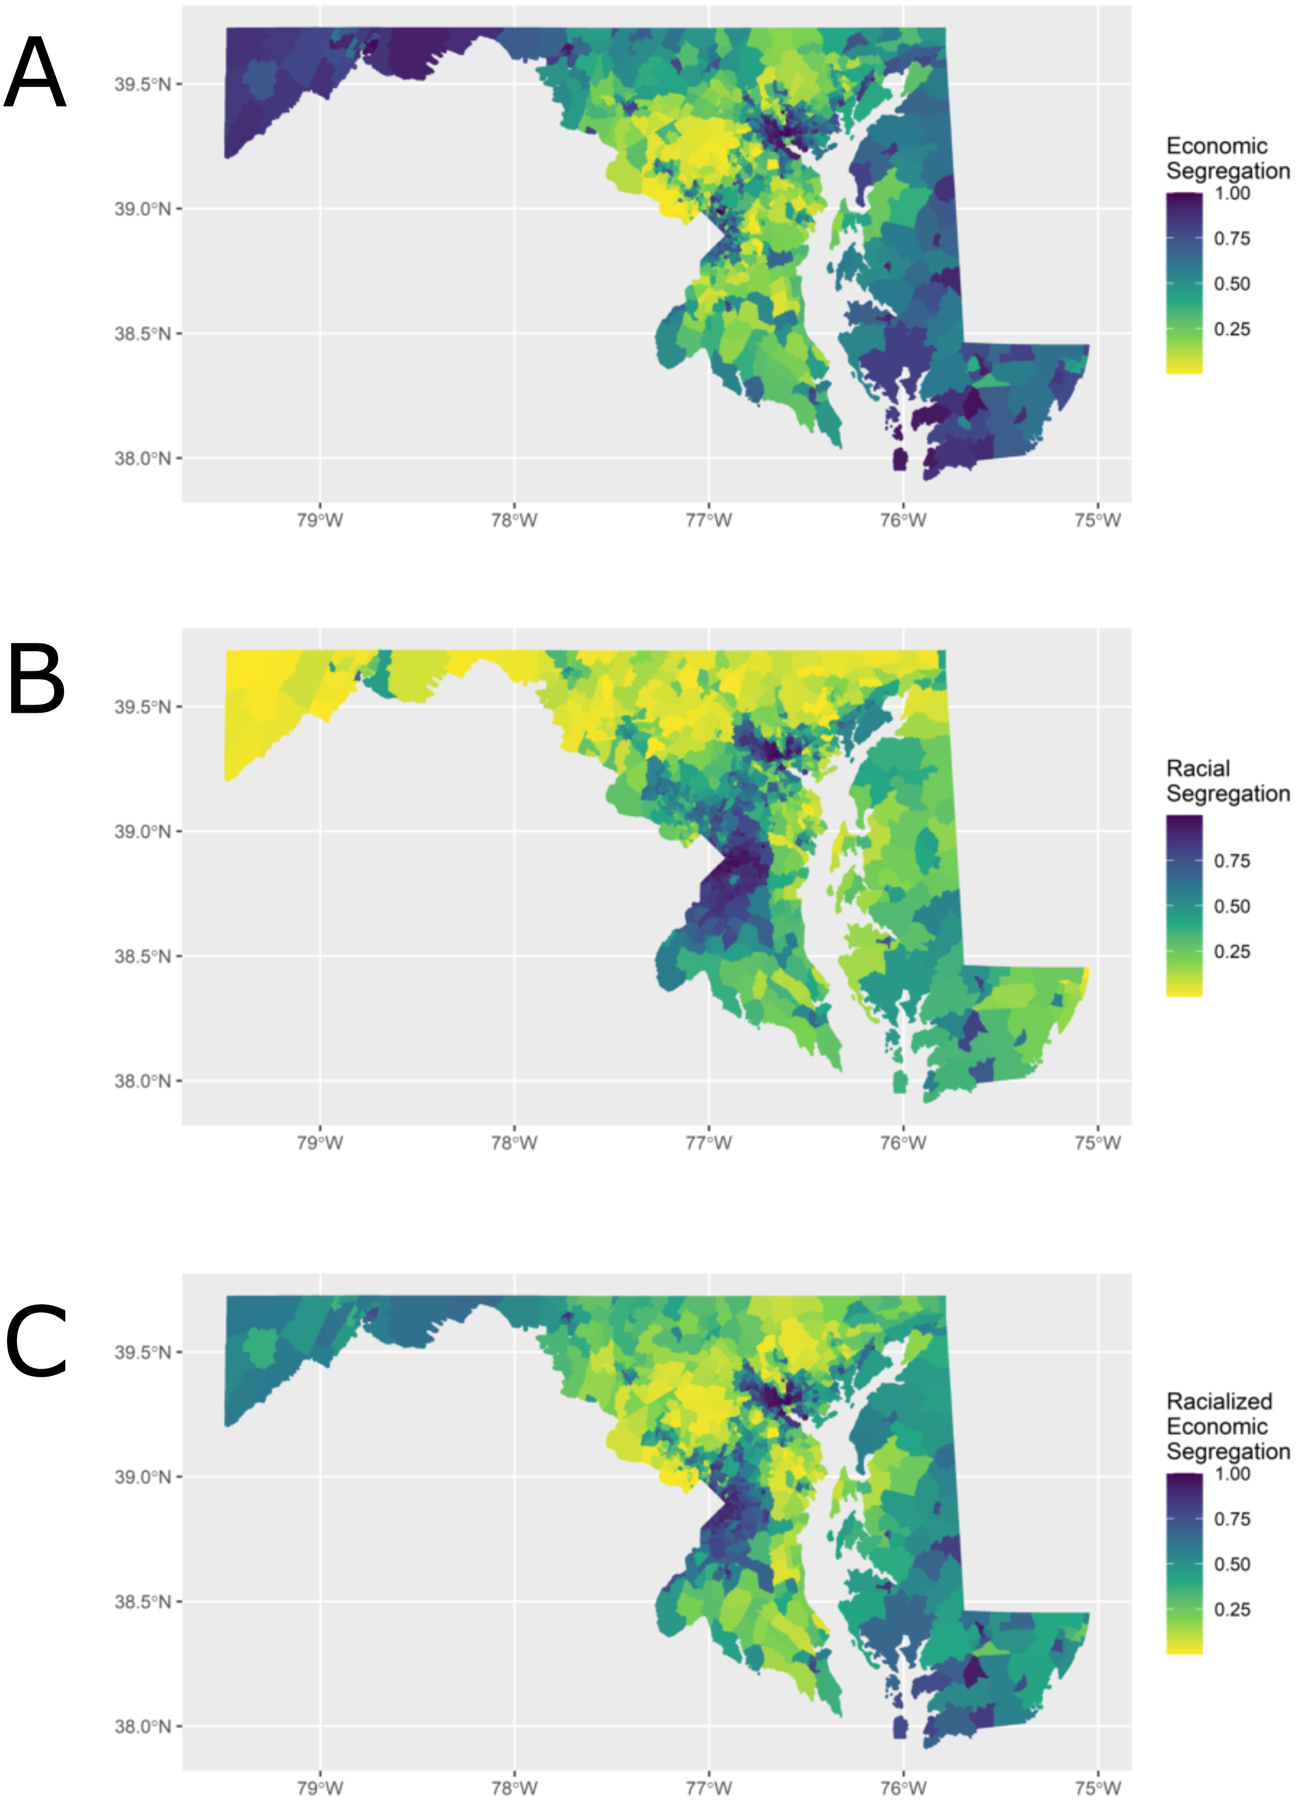
Figure 2.

Economic and Black-White racial segregation indices by census tract (ranked by percentiles) in Maryland, 2011–2015
The segregation indices are percentile ranked from 0 to 1 so that gradient in color is distributed evenly based on rank rather than absolute value.
Panel A: For economic segregation, a percentile towards 0 indicates higher concentration of high-income households (i.e., higher economic privilege) and a percentile towards 1 indicates higher concentration of low-income households (i.e., lower economic privilege.
Panel B: For racial segregation, a percentile of towards 0 indicates higher concentration of White households (i.e., higher racial privilege) and a percentile towards 1 indicates higher concentration of Black households (i.e., lower racial privilege).
Panel C: For racialized economic segregation, a percentile towards 0 indicates higher concentration of high-income White households (i.e., higher racialized economic privilege) and a percentile towards 1 indicates higher concentration of low-income Black households (i.e., lower racialized economic privilege).
