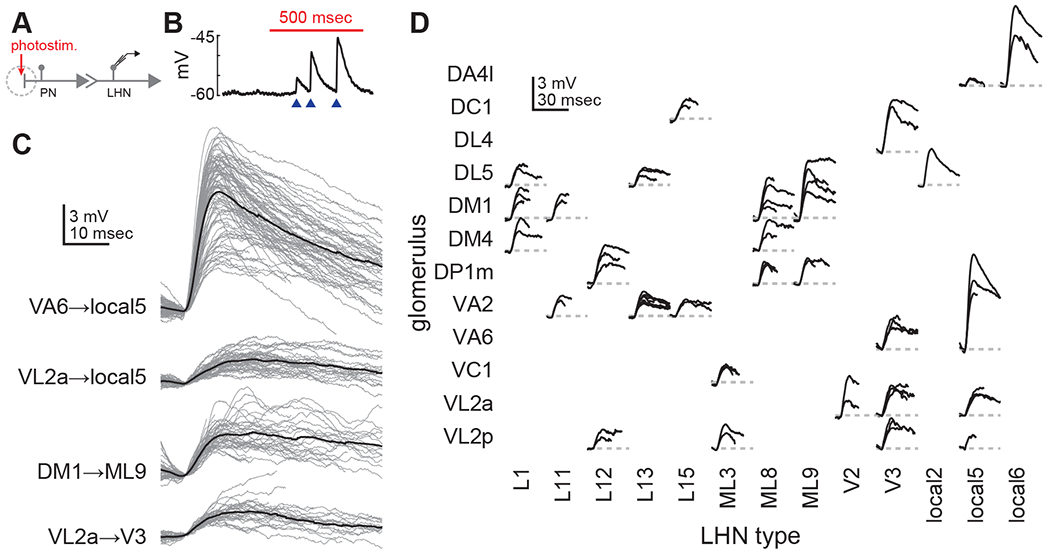
Figure 2. PN-LHN connections have diverse physiological weights.

(A) Schematic of experimental configuration. PN dendrites are photostimulated during patch-clamp recording from single LHNs.
(B) Example trace recorded from an LHN during PN stimulation (red bar). Blue arrowheads denote single uEPSPs corresponding to single PN spikes. The increasing uEPSP sizes likely reflect modest short-term facilitation of this connection.
(C) Overlaid traces (gray) of all individual uEPSPs (aligned by start time) detected from individual recordings of four different PN-LHN connections. Each black trace is the mean of all uEPSPs from one recording of one connection type.
(D) Mean uEPSP traces for all identified connections. Multiple recordings (from different flies) of the same connection type are overlaid. Variability between mean uEPSP amplitudes for different connection types is greater than for repeated recordings within the same types (ANOVA, F = 8.8, p = 3.3 × 10⁻¹³). All LHN type correspondences with hemibrain type names and bodyIds are provided in Table S2.
