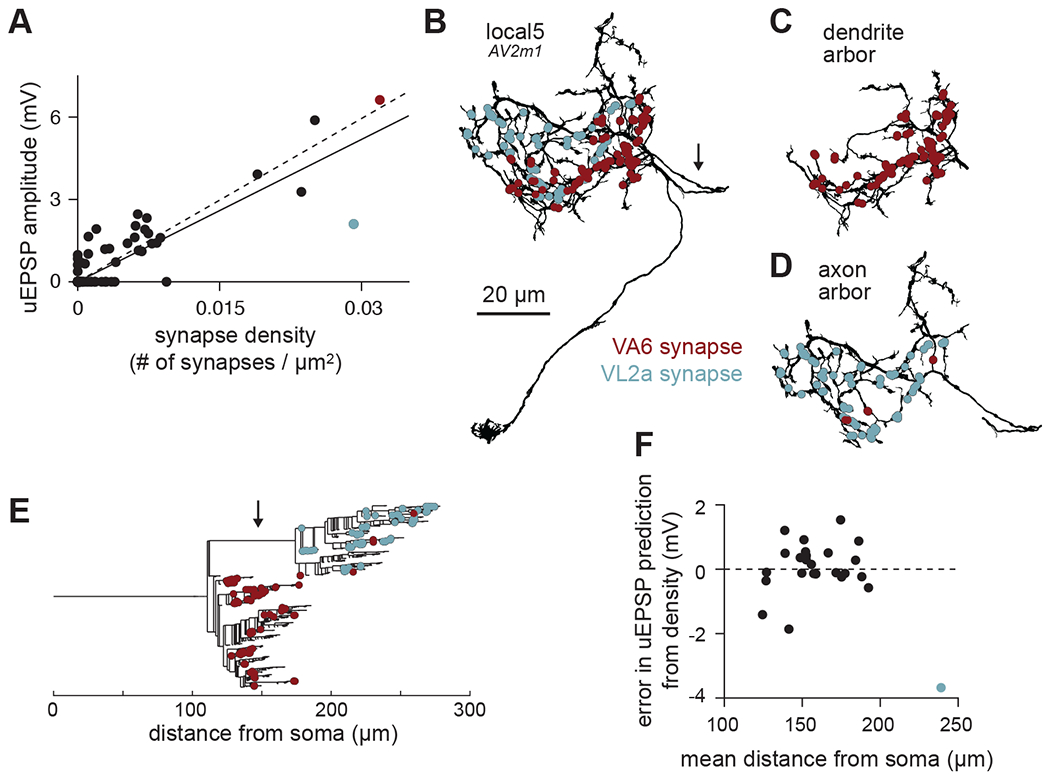
Figure 3. Anatomical diversity predicts physiological diversity of PN-LHN connections.

(A) Scatter plot of uEPSP amplitude vs. synapse density for all connections in our sample. Each point is the average value for all samples per connection type. Red and blue points correspond to the VA6 and VL2a connections onto local5. Note that many points are overlaid at the origin, corresponding to connections with no synapses detected in the hemibrain and no uEPSPs detected in physiology. Solid line is linear fit including the axo-axonic VL2a-local5 connection; dashed line excludes this connection.
(B) Morphology of a local5 neuron (hemibrain type AV2m1), with all VA6 and VL2a synapse locations labeled. Arrow identifies the inter-arbor cable, which follows a meandering path to connect the two intermingled arbors.
(C) As in (B) but showing just the dendrite arbor. Almost all the VA6 synapses are formed onto this part of the neuron.
(D) As in (B) but showing just the axon arbor. All of the VL2a synapses are formed onto this part of the neuron.
(E) Dendrogram showing the branching structure of the same local5 neuron as in (D)-(F). Almost all of the synapses onto the axon arbor are more distant from the soma than the synapses onto the dendrite arbor, which is due primarily to the inter-arbor cable (identified by arrow).
(F) Residual error in uEPSP amplitude from synapse density prediction, showing no linear correlation with mean distance of synapses from the soma. uEPSP amplitudes of dendritic inputs are thus not strongly dependent on distance. Each point is the average across all samples per connection type.
