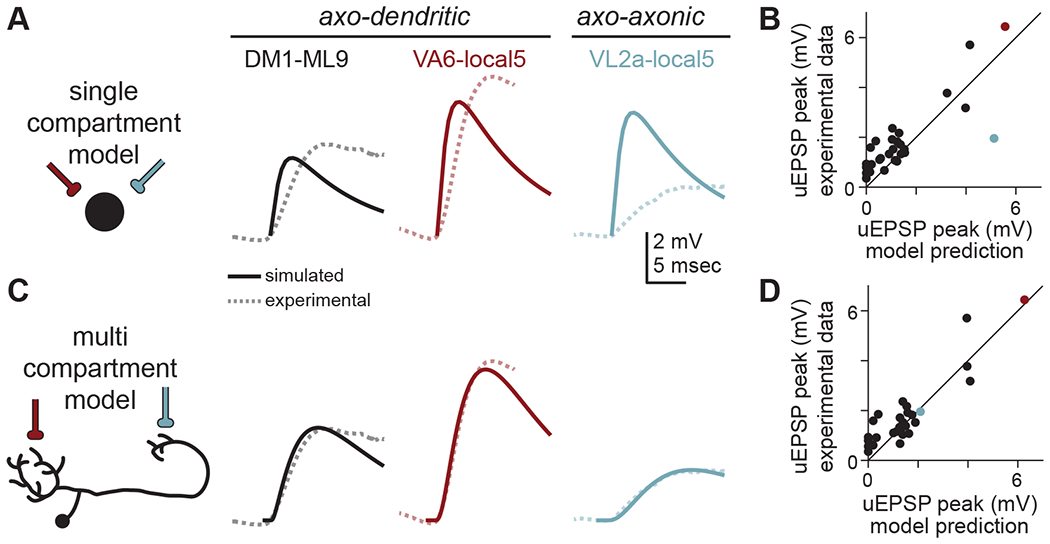
Figure 4. Multi-compartment models accurately predict uEPSP amplitudes better than single compartment models.

(A) A single compartment (point) model (schematized at left) fit to all PN-LHN uEPSPs in our sample (dashed lines) produces somatic uEPSP waveforms (solid lines) that underpredict true uEPSP amplitudes for axo-dendritic connections and overpredicts the axo-axonic connection.
(B) Peak somatic uEPSP amplitudes for all connections in our sample (with detectable uEPSPs) compared to predictions from the single compartment models. Note the blue point (corresponding to the VL2a-local5 connection) is well below the unity line, while most other points (including small amplitude connections) are above the line. Each point is the average across all samples per connection type.
(C) As in (A) but for multi-compartment models. The optimized model fits axo-dendritic connections as well as the axo-axonic connection.
(D) As in (B) but for the multi-compartment model.
See also Table S2.
