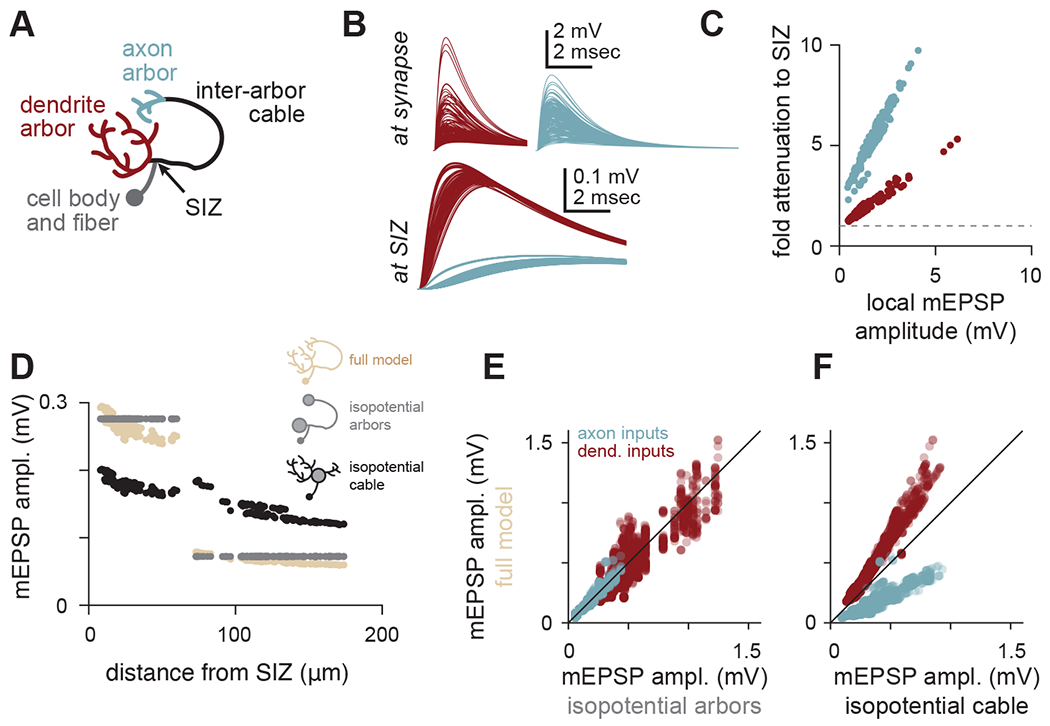
Figure 5. Arbors democratize and cables stratify synaptic efficacy.

(A) Schematic of arbors, cables, and spike initiation zone (SIZ) in local LHNs.
(B) Top: traces of simulated mEPSPs measured at each synapse (red, dendritic; blue, axonal) onto a local5 LHN (same example as Figure 3). Local mEPSPs are large with similar amounts of variability between arbors. Bottom: traces of simulated mEPSPs measured at the SIZ (note different voltage scale). Differences in mEPSPs are apparent between arbors.
(C) Local mEPSP amplitudes relate linearly to their voltage attenuation en route to the SIZ. Within each arbor, synapses with larger local depolarizations also face proportionally larger attenuation. This proportionality is different for each arbor. Red points are dendritic mEPSPs, blue points are axonal mEPSPs.
(D) mEPSP amplitudes for all ePN synapses onto the same local5 LHN (hemibrain type AV2m1), as a function of distance from the SIZ (tan). The inter-arbor cable introduces a discontinuity in this relationship: while the most proximal axonal synapses are nearly the same distance from the SIZ as the most distal dendritic synapses (~60 μm), they evoke strikingly smaller mEPSP amplitudes. Grey points are the same measurements, but for a model with isopotential arbors. Black points are for a model with an isopotential inter-arbor cable.
(E) mEPSP amplitudes simulated with the full model vs. the isopotential arbor model for all synapses across all local LHNs in our sample. The isopotential arbor model was a good predictor of the mEPSPs in the full model (r2 = 0.87).
(F) mEPSP amplitudes simulated with the full model vs. the isopotential cable model for all synapses across all local LHNs in our sample. The isopotential cable model introduces systematic biases in mEPSP amplitudes, making it a less good predictor of mEPSPs in the full model (r2 = 0.47).
