
Figure 1. Mice forage dynamically for rewards.
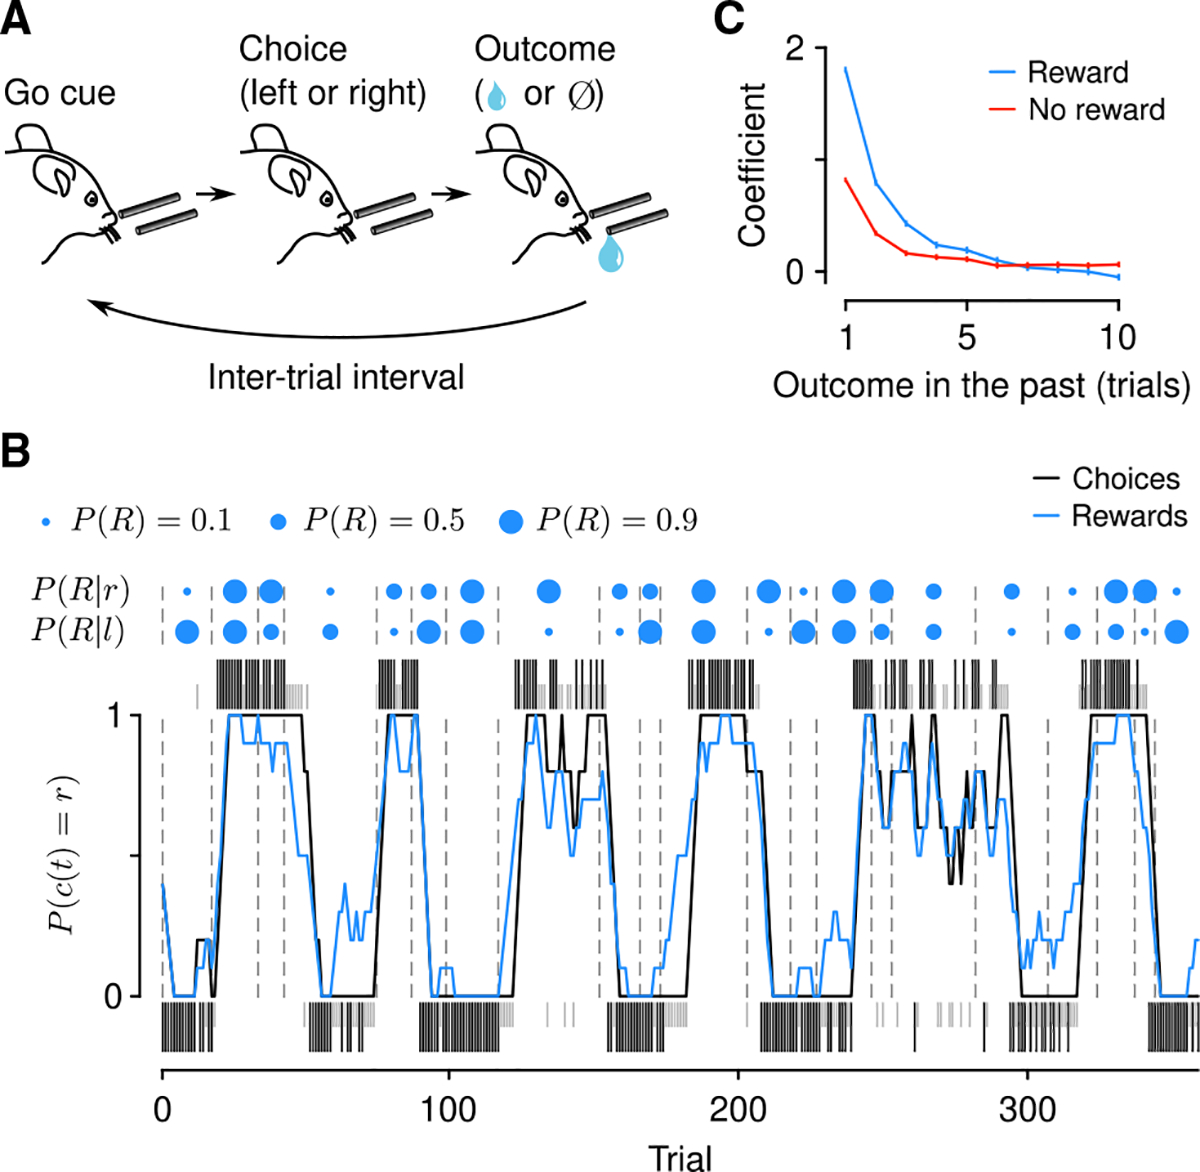
(A) Dynamic foraging task in which mice chose freely between a leftward and rightward lick, followed by a reward with a probability that varied over time.
(B) Example mouse behavior from a single session in the task. Black (rewarded) and gray (unrewarded) ticks correspond to left (below) and right (above) choices. Black curve: mouse choices (smoothed over 5 trials, boxcar filter). Blue curve: Rewards (smoothed over 5 trials, boxcar filter). Blue dots indicate left/right reward probabilities, and dashed lines indicate a change in reward probability (P(R)) for at least one spout.
(C) Logistic regression coefficients for choice as a function of outcome history. Error bars: 95% CI. See also Figure S1.