
Figure 2. Mice learn at variable rates as a function of outcome history.
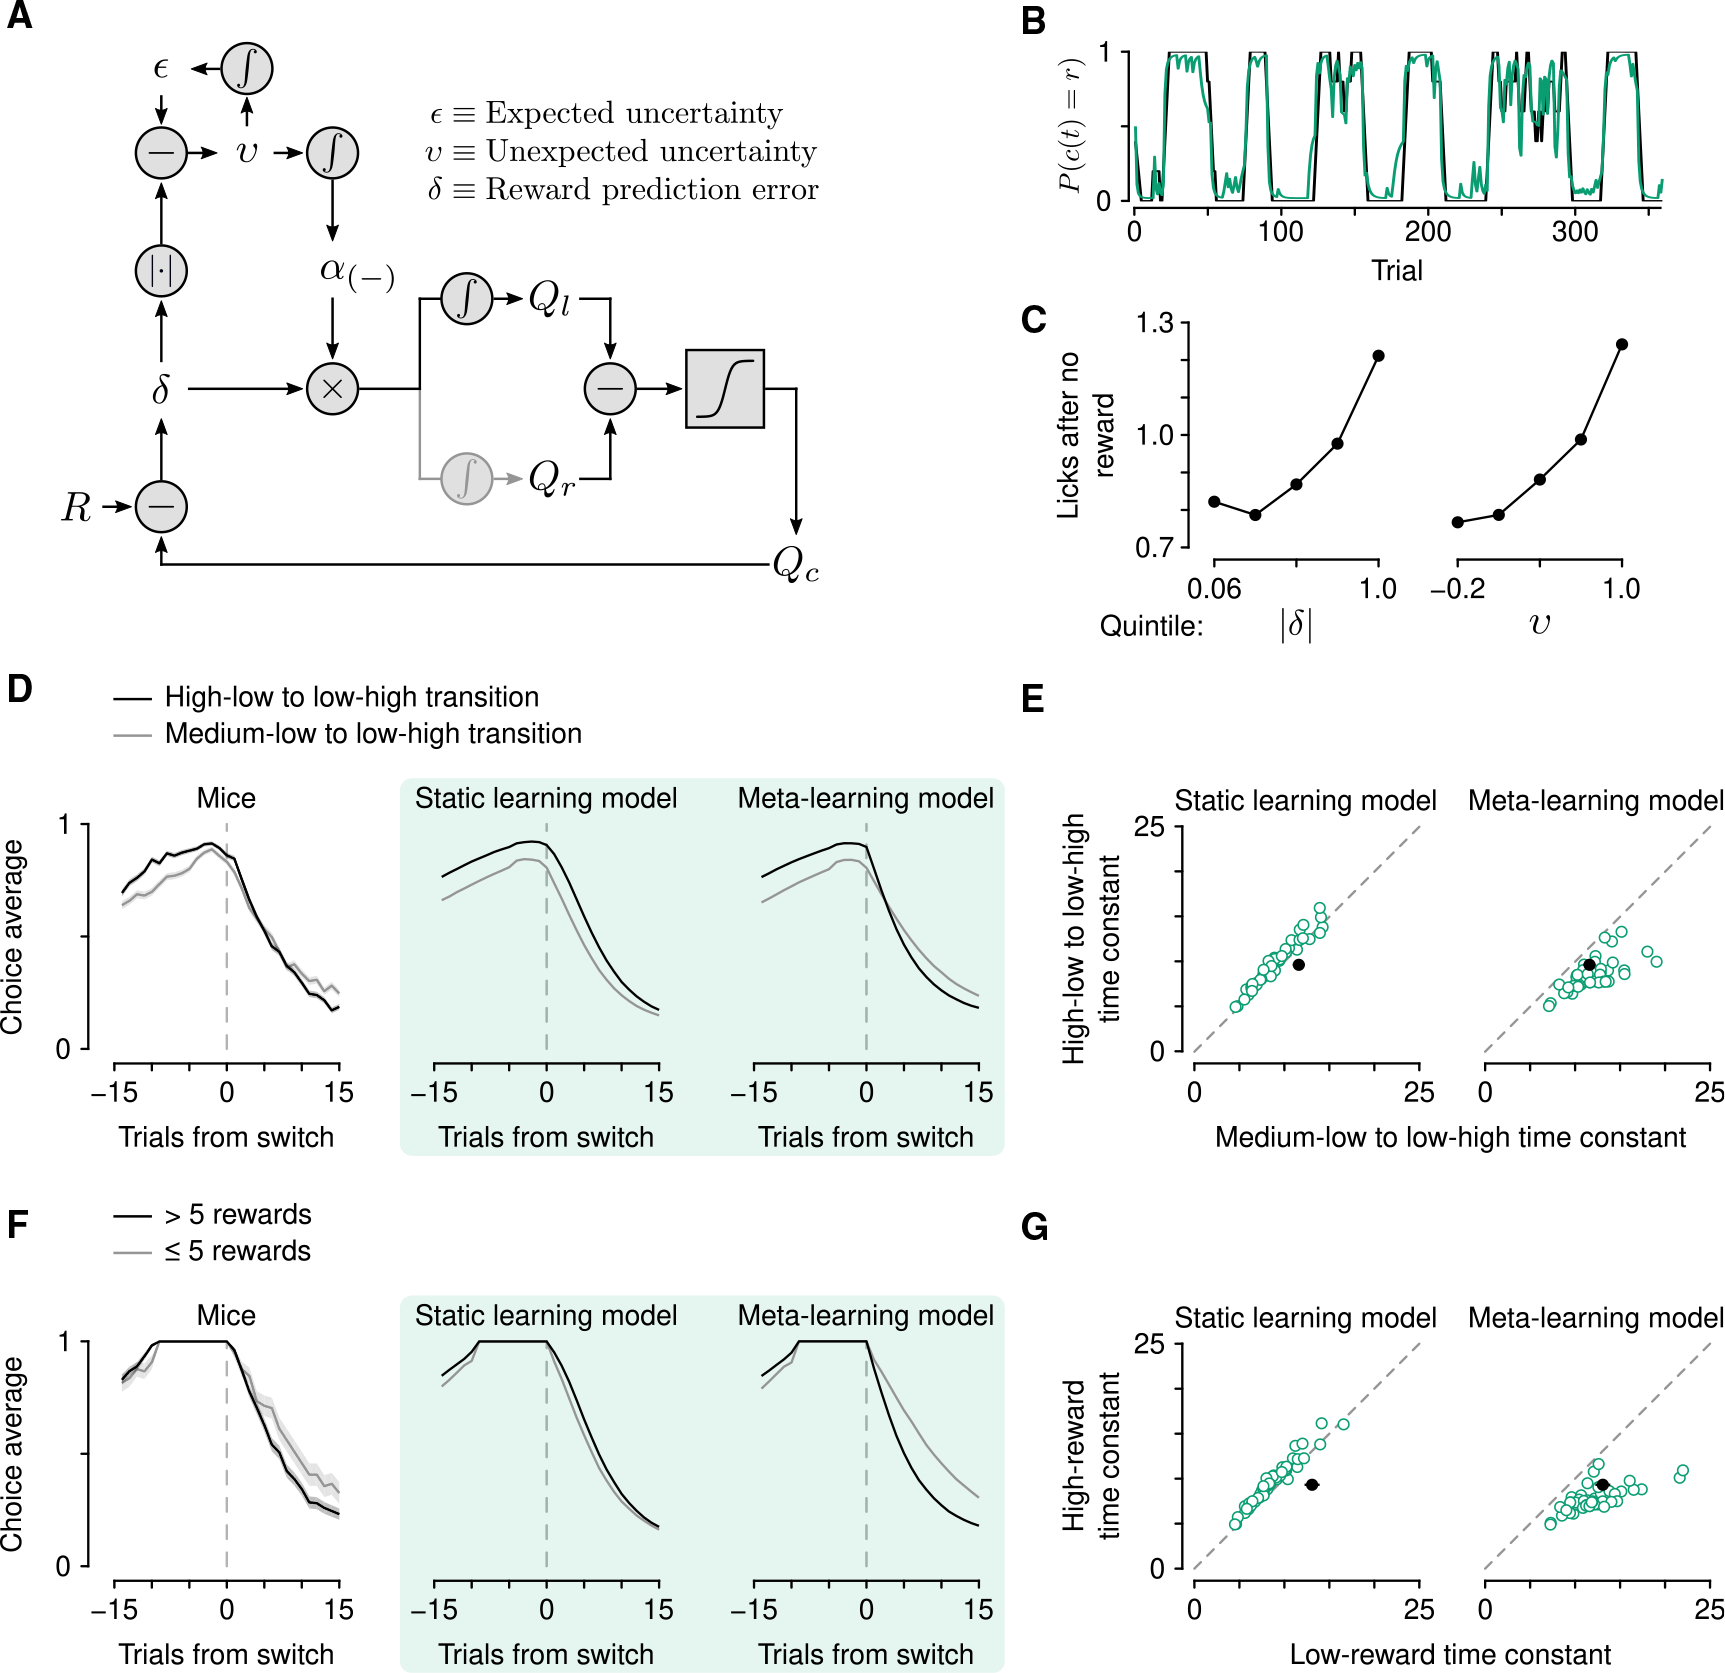
(A) Schematic of the meta-learning model algorithm. Relative value (Qr − Ql) is used to make choices through a softmax decision function. The predicted value of a choice(Qc) is compared with reward (R) to generate a reward prediction error (δ). Expected uncertainty (ε) is a recent, weighted history of |δ|. ε is compared with |δ| on a given trial to generate unexpected uncertainty (v). On no-reward trials, v is then integrated to determine how rapidly to learn from δ, thereby updating Qc.
(B) Estimated choice probability of actual behavior (black, same as Figure 1B) and choice probability estimated with the meta-learning model (green) smoothed over 5 trials (boxcar filter).
(C) Spout licks following no reward as a function of |δ| from the static learning model (left, regression coefficient = 0.45, p < 10−20) or v from the meta-learning model (right, regression coefficient = 0.56, p < 10−20).
(D) Left: Actual mouse behavior at transitions in which reward probabilities changed simultaneously(n = 384 high-low to low-high transitions, n = 347 medium-low to low-high transitions). Lines are mean choice probability relative to the spout that initially had the higher probability. Shading is Bernoulli SEM. Middle: Simulated behavior at transitions using static learning model parameters fit to actual behavior. Right: Simulated behavior at transitions using meta-learning model parameters fit to actual behavior.
(E) Time constants from exponential curves fit to simulated choice probabilities (like those shown in B) for each mouse (n = 48, green circles) compared with the actual mouse behavior (black circle). Left: Static-learning model (probability that mouse data come from simulated data distribution, p < 10−4). Right: Meta-learning model (p = 0.51).
(F) Left: Actual mouse behavior using transitions from (D) in which the animal exclusively chose the previously high or previously medium spout for 10 trials prior to the transition. Transitions were sorted into low (n = 98) and high (n = 288) reward history experienced during those 10 trials. Middle: Simulated behavior from the static learning model. Right: Simulated behavior from the meta-learning model.
(G) Time constants from exponential fits to actual (black circles) and simulated (green circles) behavior for the static (p < 10−13) and meta-learning (p = 0.38) models. See also Figures S2 and S3.