
Figure 3. Serotonin neuron firing rates respond to observable variables.
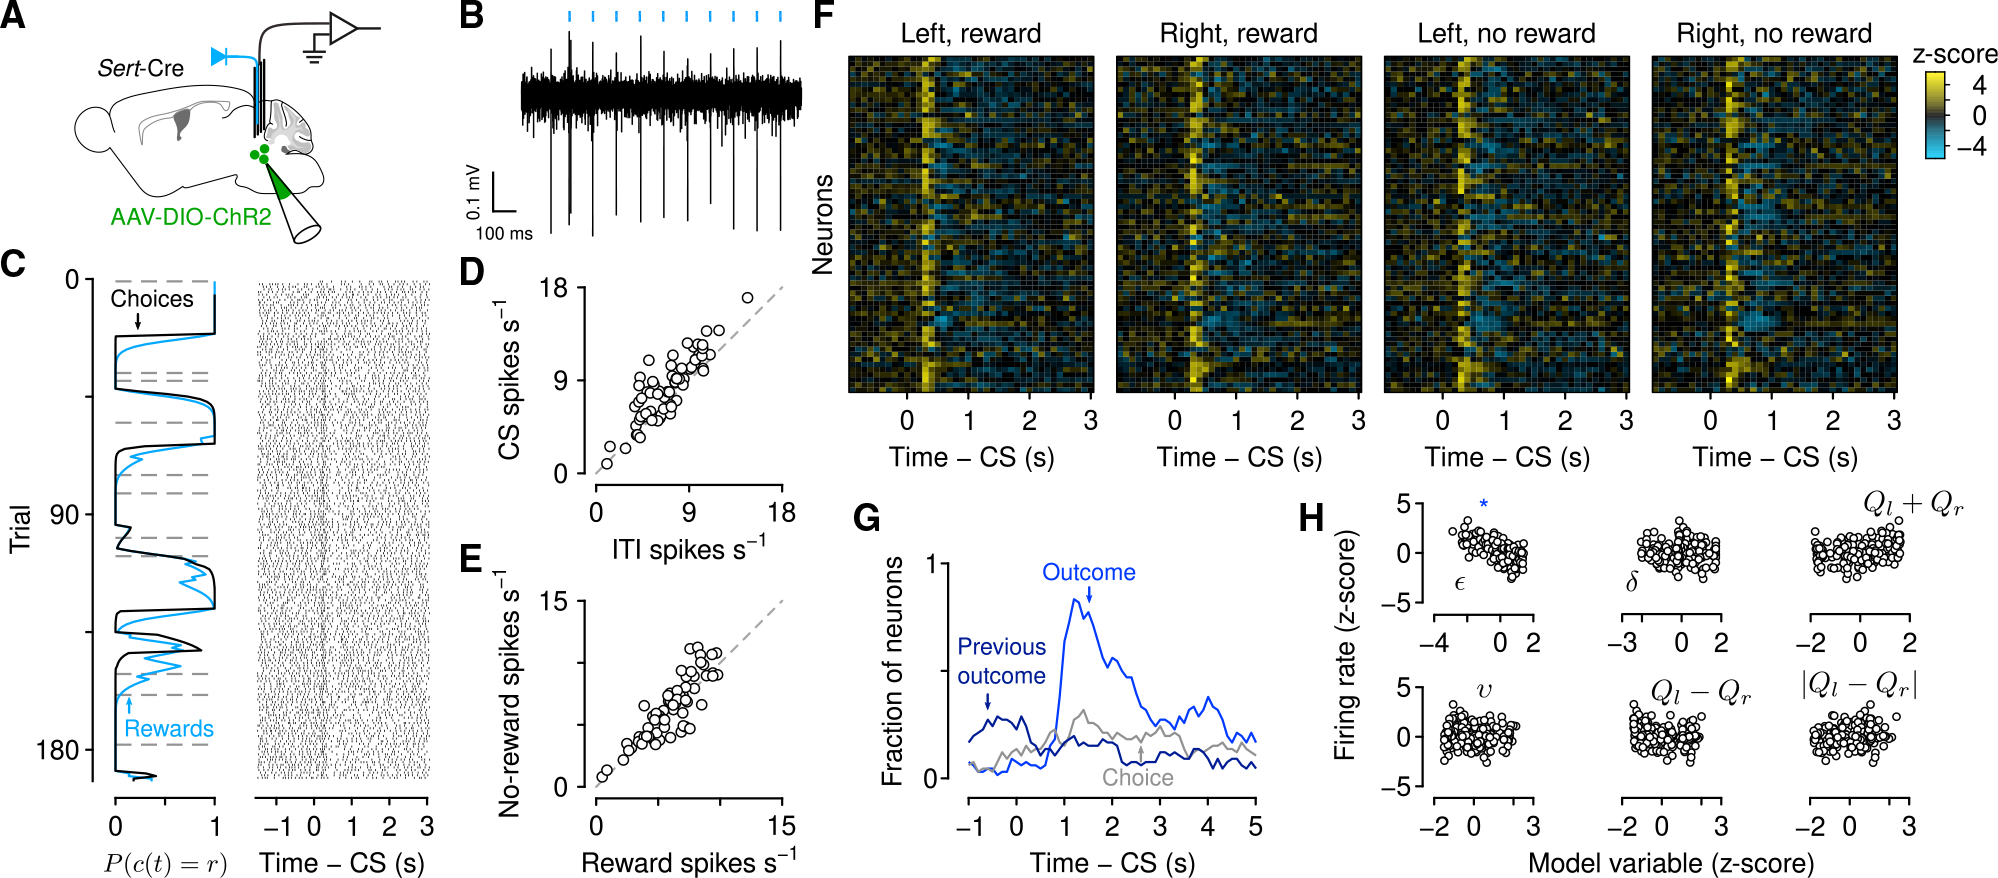
(A) Schematic of electrophysiological recording of identified serotonin neurons.
(B) Example “tagging” of a serotonin neuron, using channelrhodopsin-2 stimulation.
(C) Left: Choice and outcome probabilities for an example session, as in Figure 1B. Right: Action potential raster plots for an example neuron from that session aligned to the go cue (conditioned stimulus [CS]). Each row is a single trial aligned to the go cue.
(D) Mean firing rates during go cue and inter-trial interval for individual neurons (48 of 66 with significant increases and 14 of 66 with significant decreases, paired t tests).
(E) Mean firing rates during the outcome period (1 s after second lick) for individual neurons (13 of 66 with significantly higher responses to rewards and 30 of 66 with significantly higher responses to no rewards, two-sample t tests).
(F) Heatmap of Z-scored firing rates for all serotonin neurons, aligned to go cue, for each of the choice-outcome contingencies.
(G) Rate of significant coefficients from linear regressions of firing rates (500 ms bins) on observable variables at each time point (100 ms steps) before, during, and after the trial.
(H) The Z-scored inter-trial interval firing rates from the example neuron in (C) plotted as functions of model variables. There was a significant negative correlation with ε (blue asterisk), but not with other variables.