
Figure 5. Serotonin neuron firing rates correlate with unexpected uncertainty on fast timescales.
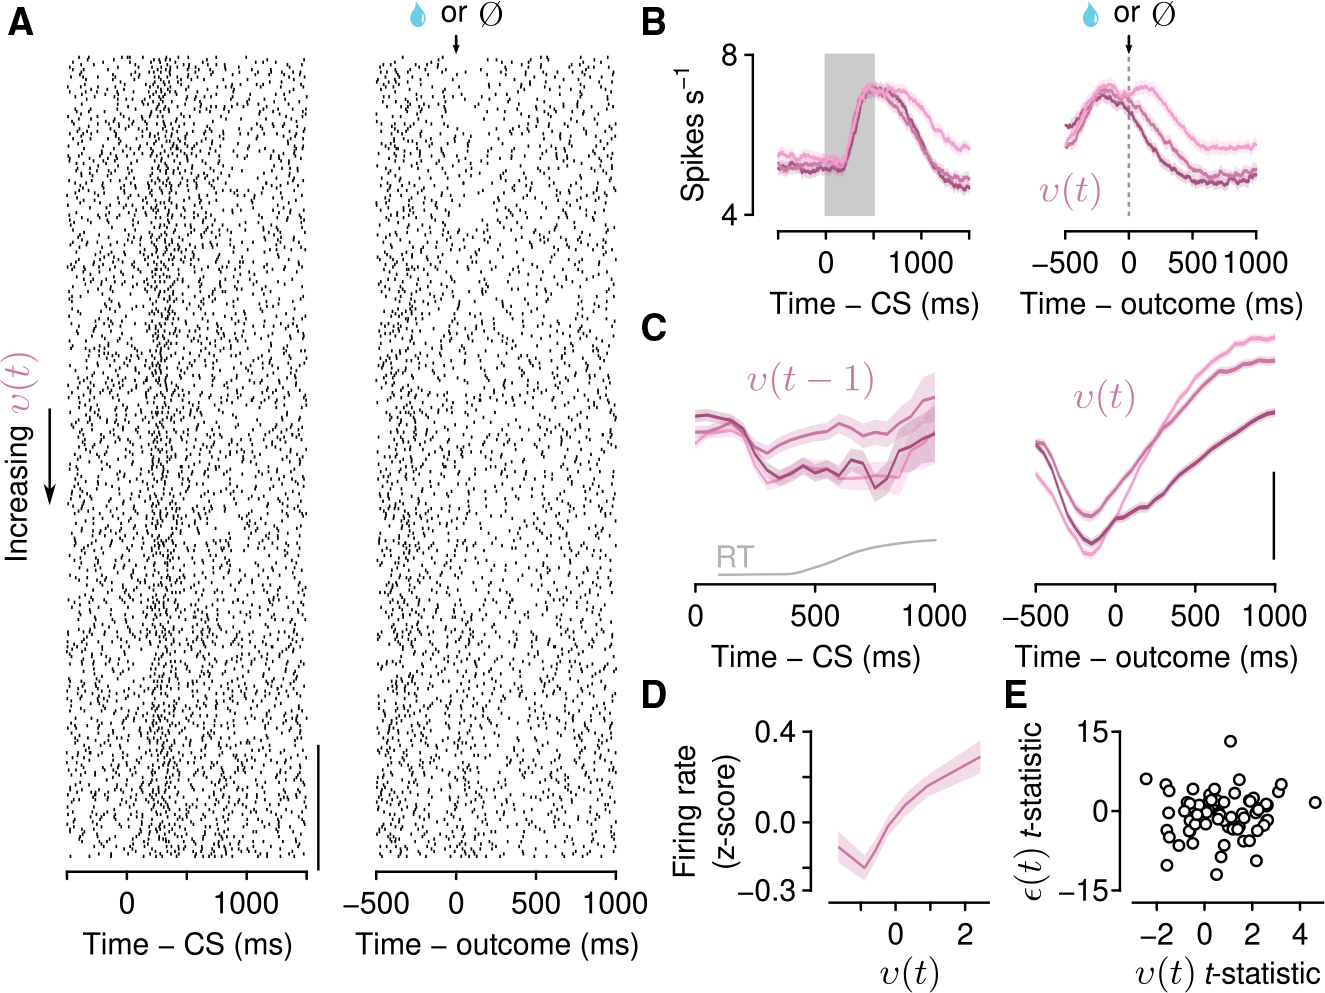
(A) Action potential raster plots for an example neuron with a significant correlation with unexpected uncertainty during the outcome aligned to cue onset (left) and outcome (second lick, right) and ordered by increasing v.
(B) Activity of the example neuron in (A) averaged within terciles (increasing values of v represented by lighter hues) of v and aligned to the go cue (gray rectangle, left, v(t − 1)) and outcome (dashed lined, right, v(t)).
(C) Within-trial dynamics of unexpected uncertainty (v(t − 1), v(t)) aligned to go cue (CS, left column) and outcome (right column) for all significant neurons (pooled by “sign-flipping” negatively correlated firing rates, also used in D). Scale bar, 0.5 Z score. Gray curve: RT distribution (cut off at 1 s).
(D) Population Z-scored firing rates plotted as a function of v(t).
(E) The t-statistics from linear regressions of outcome firing rates on v(t) and CS firing rates on ε(t) for all identified serotonin neurons.