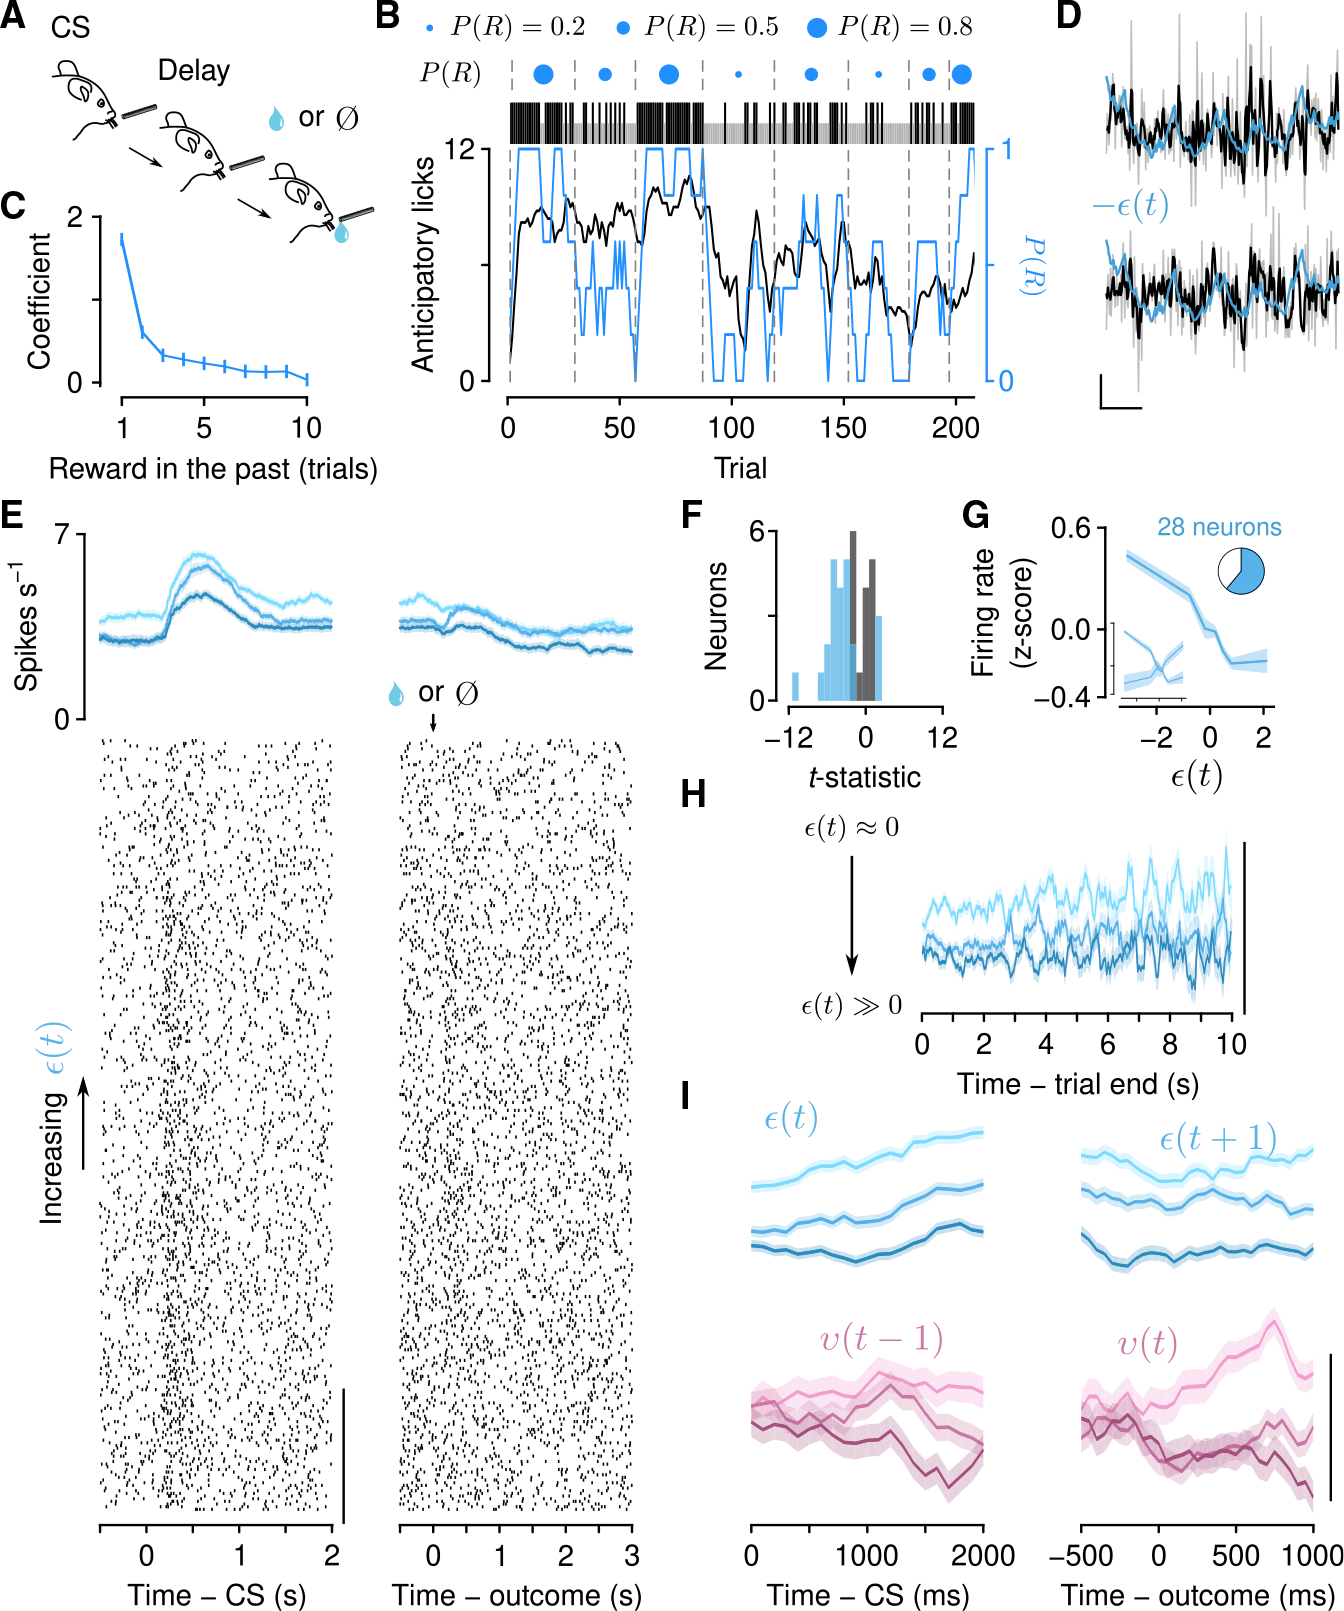
Figure 6. Serotonin neuron firing rates correlate with expected and unexpected uncertainty in a dynamic Pavlovian task.

(A) Schematic of Pavlovian task in which the probability of reward (P(R)) varied over trials.
(B) Example behavior showing anticipatory licking, in the delay before outcome, as P(R) varied. Black ticks: Rewarded trials. Gray ticks: Unrewarded trials.
(C) Linear regression coefficients of licking rate on reward history.
(D) Two example neurons showing negative correlations between inter-trial interval firing rates and expected uncertainty (−ε is plotted) when the monotonic trends are regressed out. Scale bars, 1 Z score, 50 trials.
(E) Example serotonin neuron showing a negative correlation between CS firing rates and expected uncertainty (ε(t)). Top: Firing rates averaged within terciles (represented by hue) of E and aligned to the CS (left, ε(t)) and outcome (right, ε(t +1)). Bottom: Action potential raster plots aligned to cue onset (left) and outcome (second lick, right) and ordered by increasing E.
(F) The t-statistics from linear regression, modeling inter-trial interval firing rate as a function of ε(t) as in Figure 3F.
(G) Population “tuning curves,” as in Figure 3G.
(H) Stable firing rates within inter-trial intervals, as in Figure 3I. Scale bar, 0.5 Z score.
(I) Within-trial, Z-scored firing rates as a function of uncertainty as in Figures 4E and 5C. Scale bar, 0.5 Z score. See also Figure S5.
