
. 2021 Nov 30;10(2):515–524. doi: 10.1002/fsn3.2674
© 2021 The Authors. Food Science & Nutrition published by Wiley Periodicals LLC.
This is an open access article under the terms of the http://creativecommons.org/licenses/by/4.0/ License, which permits use, distribution and reproduction in any medium, provided the original work is properly cited.
FIGURE 1.
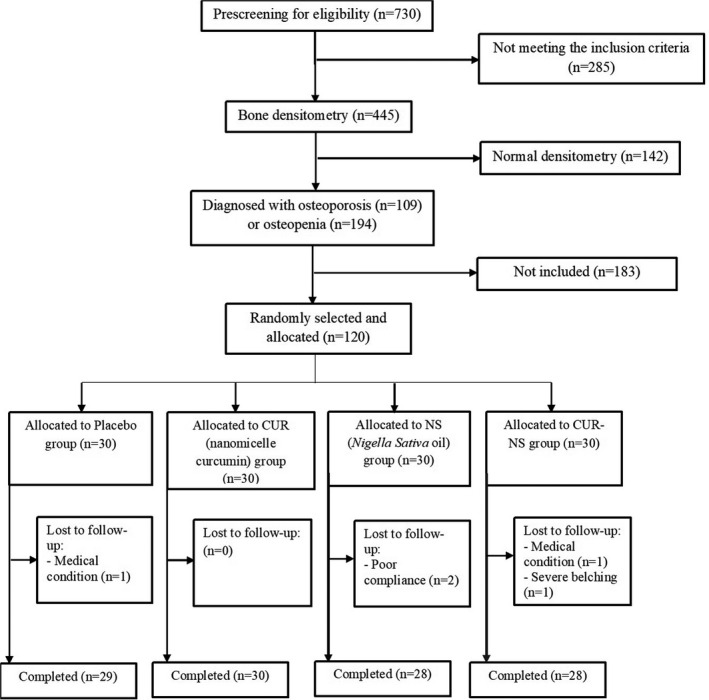
Flow chart of the study