FIGURE 2.

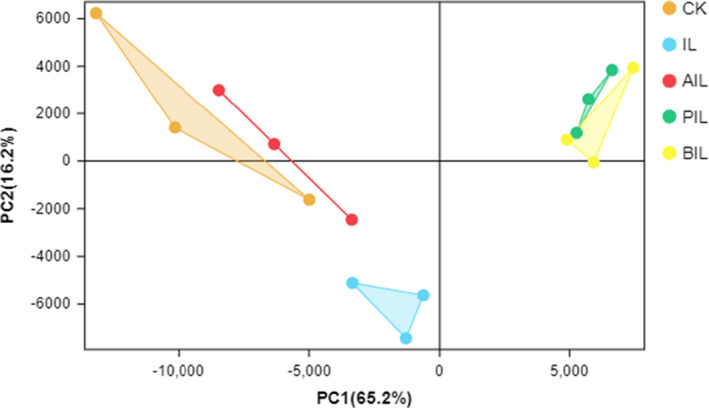
Principal component analysis (PCA) in the CK, IL, AIL, PIL, and BIL groups. CK, control group. IL, IL‐1β group. AIL, acetate+IL‐1β group. PIL, propionate+IL‐1β group. BIL, butyrate+IL‐1β group

Principal component analysis (PCA) in the CK, IL, AIL, PIL, and BIL groups. CK, control group. IL, IL‐1β group. AIL, acetate+IL‐1β group. PIL, propionate+IL‐1β group. BIL, butyrate+IL‐1β group