FIGURE 4.

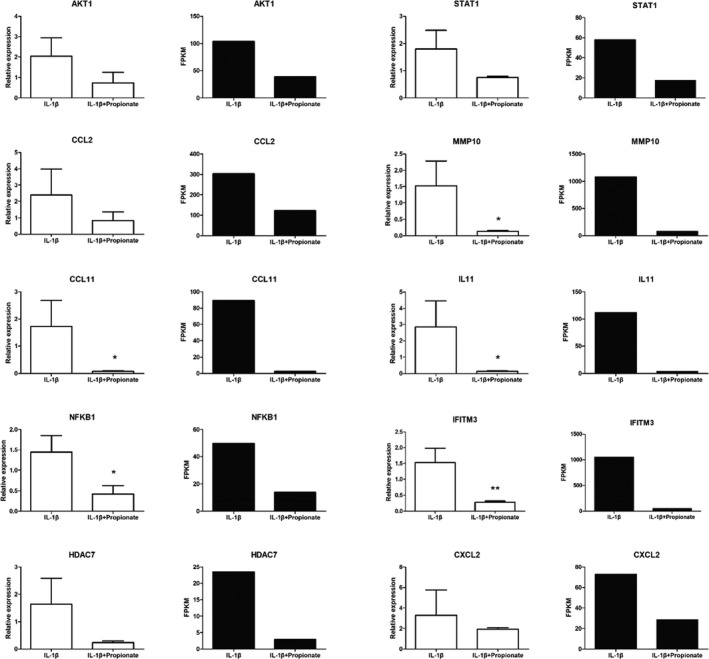
qRT‐PCR results (white) for ten DEGs compared with RNA‐seq results (black). ∗ p < .05, ∗∗ p < .01 compared with the IL‐1β group

qRT‐PCR results (white) for ten DEGs compared with RNA‐seq results (black). ∗ p < .05, ∗∗ p < .01 compared with the IL‐1β group