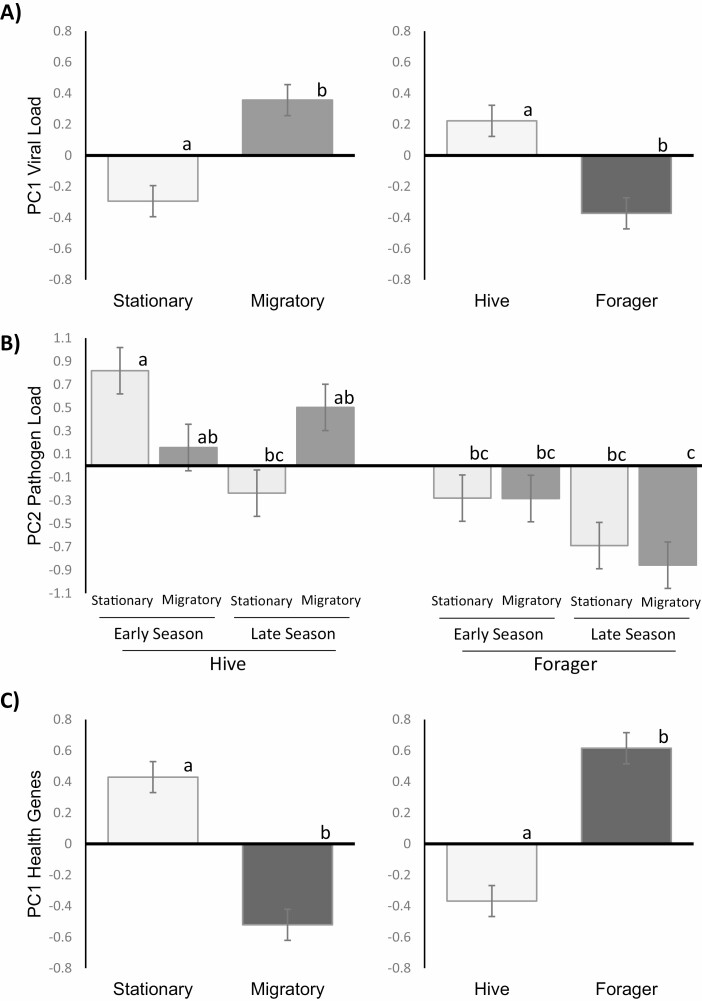
Fig. 3.
The major descriptors of the variation for the principal components analysis for A) PC1 of viral load data, B) PC2 for nonviral pathogens, and C) PC1 for the health and stress response genes. For viral load (A) and health response genes (C), the adult environment (left side) and behavioral state (right side) were highly influential on their own, while the nonviral pathogens (C) were influenced by a three-way interaction between adult environment, behavioral state and season, largely driven by the hive bees. Groups in each panel were significantly different at p < 0.05 as indicated by the letters above each bar.

