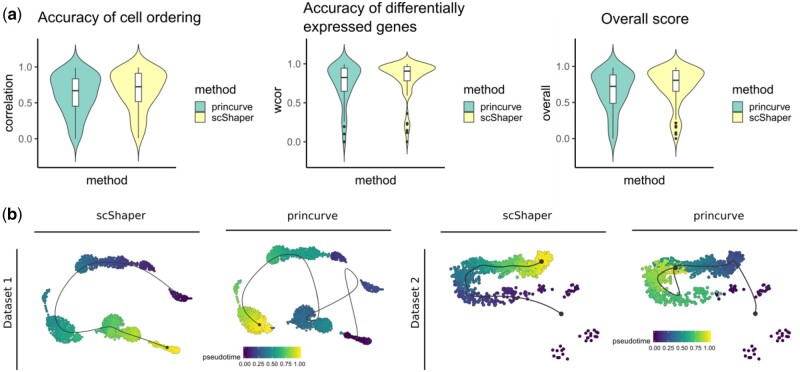
Fig. 4.
Comparison of the principal curve method (princurve) and scShaper for linear trajectory inference of scRNA-seq data. (a) The same benchmarking as in Section 3.2. (b) Trajectory visualizations of two simulated datasets, prosstt_linear_3 and prosstt_linear_6, from the comparison study. The colouring in each plot denotes the estimated pseudotime by the method. In all visualizations the trajectory line estimated using the dynplot R package is an approximation of the estimated pseudotime, and therefore the trajectory line bypasses some of the small subpopulations with fewer cells. In all the analyses we used the same dimensionality reduction workflow (Section 2.2) with both methods

