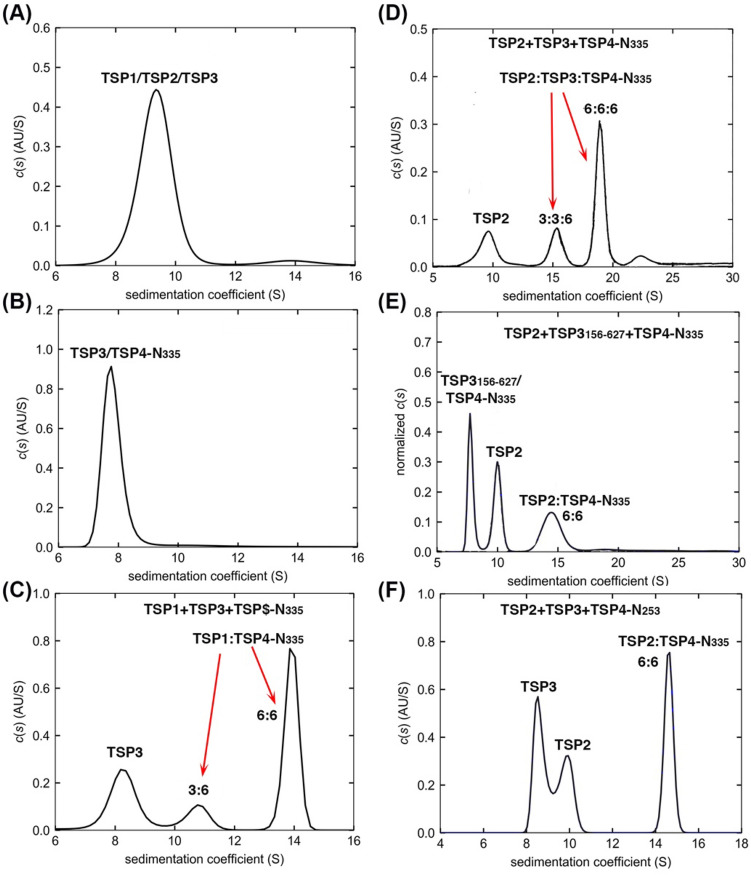
Figure 8.
SV analyses of the interactions of TSP3 with partner TSPs (A) The c(s) distribution profile of a mixture containing 1.5 μM each of TSP1, TSP2 and TSP3 shows no interactions between these proteins. (B) The c(s) distribution profile of 5 μM each of TSP4-N335 and TSP3 shows no association between the two proteins. (C) The c(s) distribution profile of 5 μM each of TSP4-N335, TSP1 and TSP3 revealed no association between TSP3 and the TSP1:TSP4-N335 binary complex. (D) The SV profile of 1.5 μM each of TSP4-N335, TSP2 and TSP3 shows a ternary complex formation. (E) The c(s) distribution profile of 3 μM TSP4-N335, 2.5 μM TSP2 and 3 μM TSP3156-627 shows no ternary complex when the TSP3 head is absent. (F) The SV profile of a mixture containing 3.1 µM TSP4-N253, 2.5 µM TSP2 and 2.5 µM TSP3 shows that TSP3 does not bind to the TSP2:TSP4-N253 binary complex lacking the TSP4 XD1 domain.

