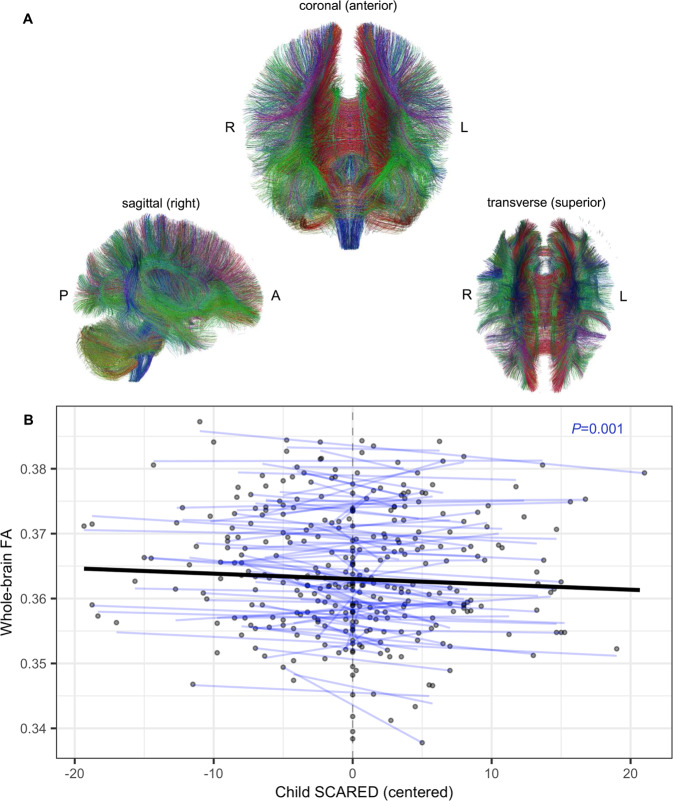
Fig. 2. Longitudinal within-participant association of whole-brain FA with child SCARED scores.
A Coronal, sagittal, and transverse views of a 3-D rendering of whole-brain WM tracts, as generated via deterministic tractography in TrackVis (A-P anterior-posterior; R-L right-left). Green fibers extend along anterior-posterior axis; red fibers along the medial-lateral axis; and blue fibers along the superior-inferior axis. B Within-participant relationship between whole-brain FA and child SCARED scores. Each blue line represents a participant-specific regression line predicting whole-brain FA from within-participant centered child SCARED scores, while controlling for age. Each point represents an individual scan. The bolded black line depicts the average within-participant association of whole-brain FA with child SCARED scores.

