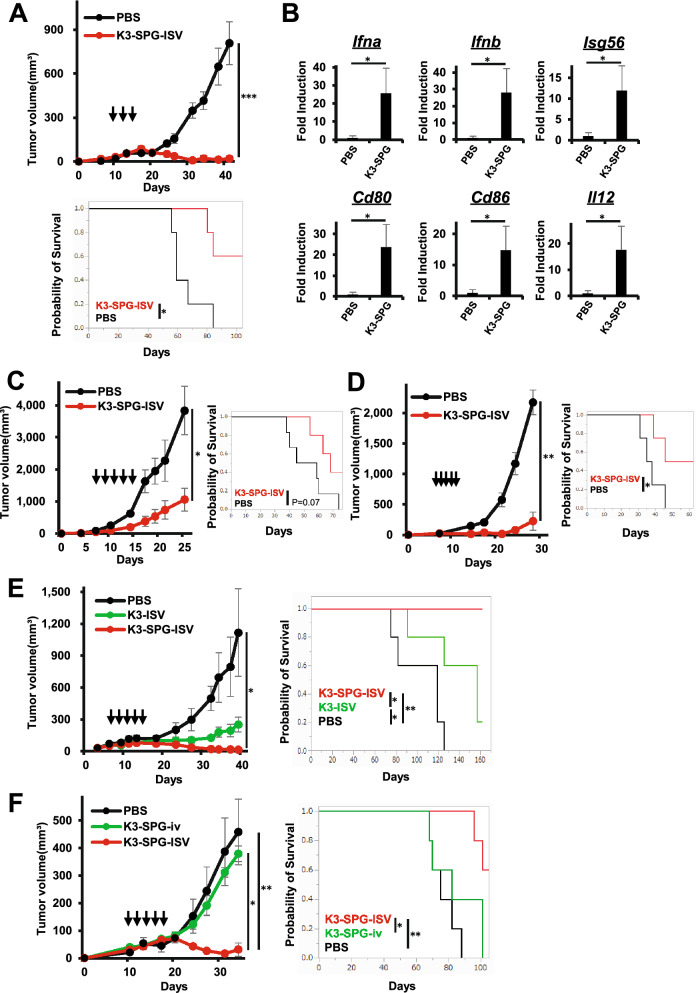
Figure 2.
K3-SPG-ISV induces intratumoral type I IFN and Th1 type immune responses, suppresses tumor growth, and prolongs survival. (A) Tumor volume (upper panel) and survival rate (lower panel) were monitored among KPC-N-bearing mice treated with PBS or K3-SPG-ISV (10 μg) on days 10, 13, and 15 after tumor inoculation (n = 5). (B) Intratumoral mRNA expression levels of the indicated genes on day 19 in the same experimental protocol were measured by quantitative real-time PCR (n = 3). The results were normalized to the expression of 18S rRNA. (C) Tumor volume (left panel) and survival rate (right panel) were monitored among colon-26-bearing mice treated with PBS or K3-SPG-ISV (10 μg) on days 7, 9, 11, 13, and 15 after tumor inoculation (n = 6). (D) Tumor volume (left panel) and survival rate (right panel) were monitored among MC38-bearing mice treated with PBS or K3-SPG-ISV (10 μg) on days 7, 8, 9, 10, and 11 after tumor inoculation (n = 4). (E) Tumor volume (left panel) and survival rate (right panel) were monitored among KPC-N-bearing mice treated with PBS, K3-ISV (30 μg), or K3-SPG-ISV (10 μg) on days 7, 9, 11, 13, and 15 after tumor inoculation (n = 5). (F) Tumor volume (left panel) and survival rate (right panel) were monitored among KPC-N-bearing mice treated with PBS, K3-SPG-ISV (10 μg), or K3-SPG-iv (10 μg) on days 10, 12, 14, 17, and 18 after tumor inoculation (n = 5). The data are representative of three independent experiments with similar results. The arrows indicate the timing of therapy. Error bars represent the mean ± SEM. Statistically significant differences were measured by one-way ANOVA followed by Dunnett’s post hoc tests (panel A, B, C and D) and the Tukey–Kramer test (panel E and F). *p < 0.05; **p < 0.01; ***p < 0.001. Survival curves were analyzed using log-rank tests. iv, intravenous.

