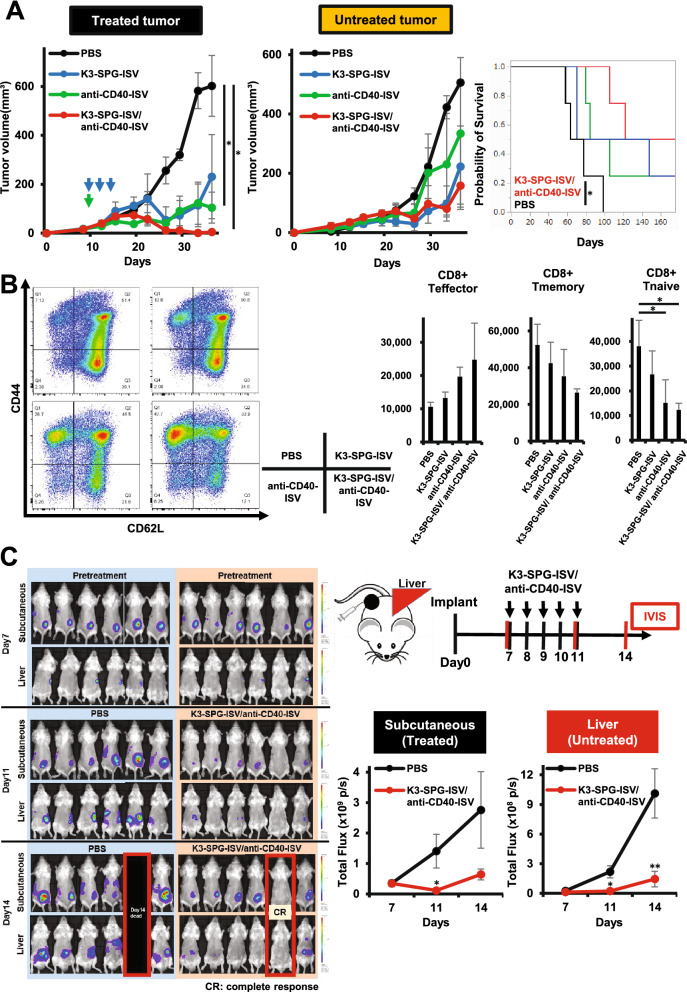
Figure 6.
Combined ISV strategy incorporating agonistic CD40 antibody into K3-SPG enhances antitumor effect. (A) Mice bearing bilateral subcutaneous KPC-N tumors were treated with PBS, K3-SPG-ISV (10 μg on days 9, 12, and 14), anti-CD40-ISV (20 μg on day 9), and a combination of K3-SPG-ISV/anti-CD40-ISV (same dose and schedule as respective monotherapy) (n = 4). Tumor volume of the treated side (left panel) and untreated side (center panel) and survival curves (right panel) are shown. Data are representative of two independent experiments with similar results. (B) Splenocytes were isolated on day 19 of the experiment under the same protocol described in panel A, stained with fluorochrome-conjugated antibodies, and subjected to flow cytometric analysis for identification of naïve, memory, effector CD8 T cells. Gating strategy is shown in Supplementary Fig. 6. Representative flow cytometry plots from two independent experiments are shown (left panel). Right panels show the absolute number of effector, memory, and naïve CD8 T cells within 106 splenocytes (n = 3). (C) Liver metastatic model mice harboring firefly luciferase-tagged colon-26 were treated with PBS or a combination of K3-SPG-ISV (10 μg)/ anti-CD40-ISV (100 μg) on days 7, 8, 9, 10, and 11 after tumor inoculation (n = 6). Right upper panel shows the experimental design. Red vertical bars indicate the timing of bioluminescence imaging with IVIS. Left panel shows bioluminescence images, taken after 7, 11, and 14 days of implantation. Right lower panel shows the bioluminescence signal intensity of control and in situ vaccinated mice for monitoring tumor volumes. The arrows indicate the timing of therapy. Error bars represent the mean ± SEM. Statistically significant differences were measured by one-way ANOVA followed by the Tukey–Kramer test (A, B) and Dunnett’s post hoc tests (C). *p < 0.05; **p < 0.01. Survival curves were analyzed using the log-rank test.

