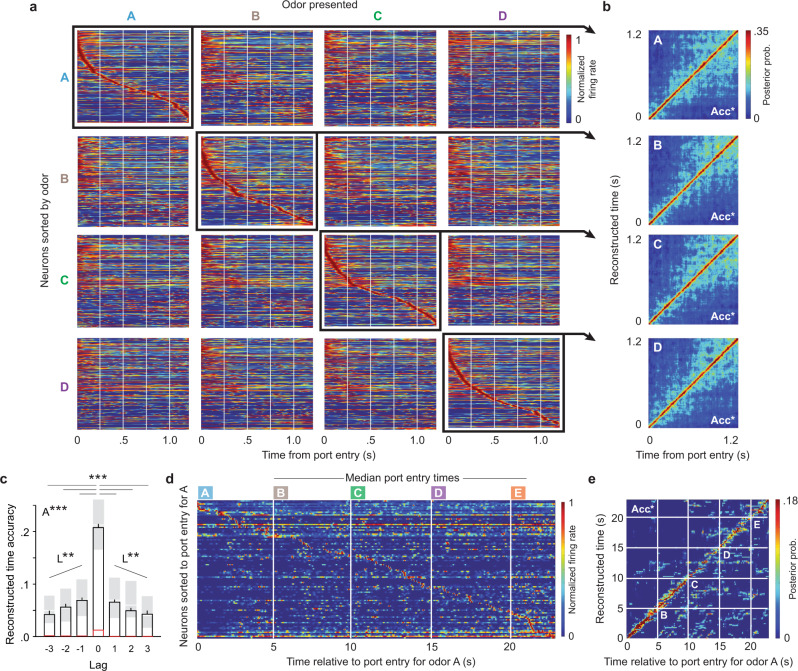
Fig. 2. CA1 ensembles display sequences of firing fields (“time fields”) within individual events, which vary by the associated stimulus and sequence position, and across event sequences.
a Stimulus-specificity in sequential firing fields. Peri-stimulus time histograms (PSTH; 150 ms gaussian) show the normalized firing rate of all active neurons for each odor type (correct InSeq trials only; active neurons for each odor: A = 267, B = 192, C = 209, D = 223; neurons collapsed across five subjects, one session per subject). To visualize how sequential firing fields varied across odor types, PSTHs are shown for each odor presented (in columns), with neurons sorted by their time of peak firing relative to the port entry for each odor (in rows). b Temporal coding accuracy for each odor type was above-chance levels. Plots show reconstructed time estimates obtained from each animal’s PSTH (correctly sorted for each odor; i.e., diagonal of panel a but separated by animal) and averaged across subjects. c Accuracy of reconstructed time varied by the lag between the odor type used to train the model and the odor type in which time was reconstructed (e.g., when the model was trained on odor B trials, decoding time during odor B, C, D or E trials represented lags of 0, 1, 2, or 3, respectively). Black bars depict mean ± SEM (Lag 0: n = 220; Lag ± 1: n = 165; Lag ± 2: n = 110; Lag ± 3: n = 55; trial data pooled across subjects), shaded regions the Q1–Q3 range (median denoted by white line), and red lines the permuted chance levels. Lag data show a significant one-way ANOVA (F(6,873) = 166.9, p < 0.0001; A***), difference between lag 0 and all other lags (two-tailed Dunnett’s posthoc tests, adjusted for multiple comparisons; ***p < 0.0001), and linear trends (positive lag: F(1,327) = 12.93, p = 0.0004; negative lag: F(1,327) = 12.20, p = 0.0005; L**). d The sequential organization of firing fields extended across the full sequence of odors. Since the task is self-paced, the PSTH (250 ms gaussian) shows data from a single subject with median times for odors B, C, and D across sequences. e Accuracy of reconstructed time across the sequence of odors (PSTH from panel d) was above-chance levels. Acc*, reconstructed time accuracy significantly above-chance levels (determined by random permutations). Color coding of odor types: odor A = sky blue, B = brown, C = green, D = purple, E = orange.

