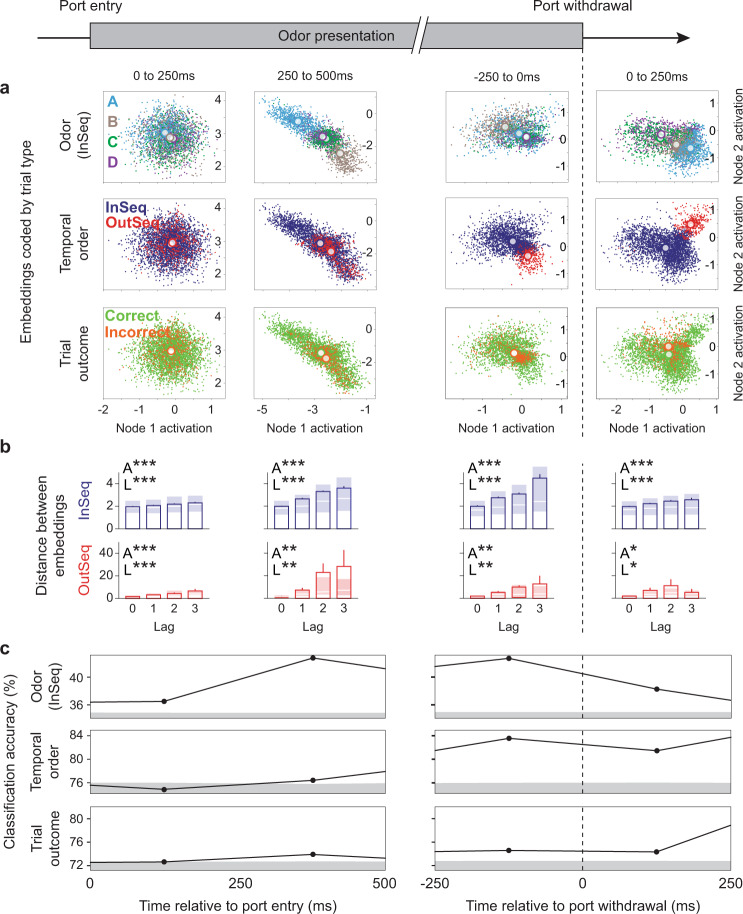
Fig. 3. Stimulus identity, temporal order, and trial outcome information are simultaneously differentiated, but peak at different times, within events.
A deep learning latent representation approach was used to identify the underlying structure of ensemble activity in four 250 ms windows matching behavior across InSeq and OutSeq trials, to which trial labels were subsequently applied. a Differentiation of stimulus (odors: A = sky blue, B = brown, C = green, D = purple; correct InSeq trials only), temporal order (InSeq in navy blue, OutSeq in red; correct trials only), and trial outcome (correct trials in light green, incorrect trials in dark orange) information in example subject. The model reduced the dimensionality of each animal’s ensemble activity to two dimensions, which correspond to the activation level of the two nodes in the middle layer of the autoencoder (see “Methods” section). Each point representing a 100 ms slice of spike activity data projected onto this two-dimensional space (white circles indicate cluster centroids). To better visualize cluster separation at different moments within trials, the model was run separately on each 250 ms window (shown in columns; plots are on same scale within a column but are re-scaled across columns). b The distance between clusters scaled as a function of lag (the distance between odors in the sequence) for both InSeq and OutSeq trials. Bars depict mean ± SEM (correct trials only; trial data pooled across subjects) and shaded regions the Q1–Q3 range (median denoted by white line). Data from InSeq trials is shown in navy blue (lag 0: n = 664; lag 1: n = 995; lag 2: n = 664; lag 3: n = 333) and OutSeq trials in red (lag 0: n = 46; lag 1: n = 32; lag 2: n = 26; lag 3: n = 14). Lag data show significant one-way ANOVAs (A*, p < 0.05; A**, p < 0.005; A***, p < 0.0001) and linear trends (L*, p < 0.05; L**, p < 0.005; L***, p < 0.0001; see Supplementary Table 3). c Differentiation (mean classification accuracy; trials pooled across subjects) for each type of information relative to chance levels. Since two-dimensional embeddings were specific to each rat’s neuronal ensemble, classification accuracy for each trial was calculated using a k-nearest neighbor approach (k = 2) to allow trial data to be pooled across subjects. Gray bands represent chance-level classification accuracy (values below +95% CI; determined by random permutations). Vertical dotted line indicates port withdrawal time.

