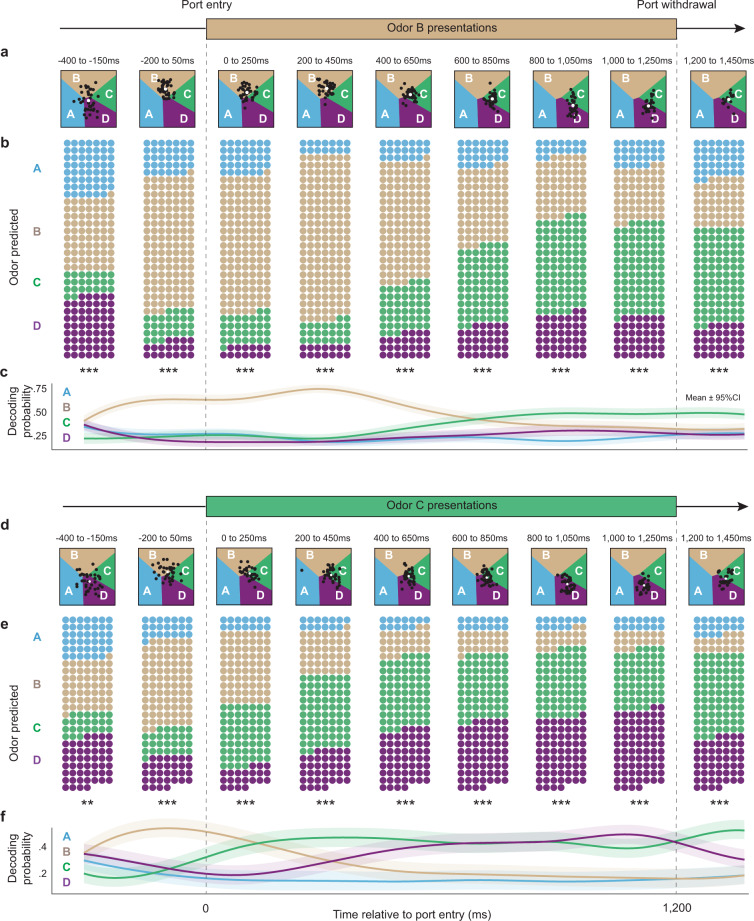
Fig. 4. The neural representation of sequences of discontiguous events is reactivated within individual events.
A deep learning neural decoding approach was used to quantify the decoding probability of each odor representation in 250 ms windows (correct InSeq trials only). a Decoding dynamics during odor B presentations in example subject. Regions of latent space are color-coded according to the odor of highest probability (odor A = sky blue, B = brown, C = green, D = purple), with boundaries indicating equal probability between two odors. Each black dot indicates the latent representation of a trial in that time window, with its position representing the decoded probabilities for each odor (cluster centroids shown as white circles). b, c Group decoding dynamics during odor B presentations. Since latent space coordinates were specific to each rat’s neuronal ensemble, trial data were pooled across subjects according to each trial’s highest probability value. Specifically, for each time window, trials (represented by circles; n = 210) were categorized and color-coded by their decoded odor of highest probability, with the number of circles in each window reflecting the decoded probability for each odor (b). The same data are shown in a summary line plot to highlight the decoding probability dynamics within trials (c). d Decoding dynamics during odor C presentations in the same example subject. e, f Group decoding dynamics during odor C presentations. The same approach as above was used to aggregate trial data across subjects (n = 165 trials). Data in b, e show significant chi-square tests in all time windows (df = 3; **p < 0.005; ***p < 0.0001). Summary line plots in c, f depict decoding probability for each odor (mean ± 95% multinomial CI; smoothed using cubic splines).

