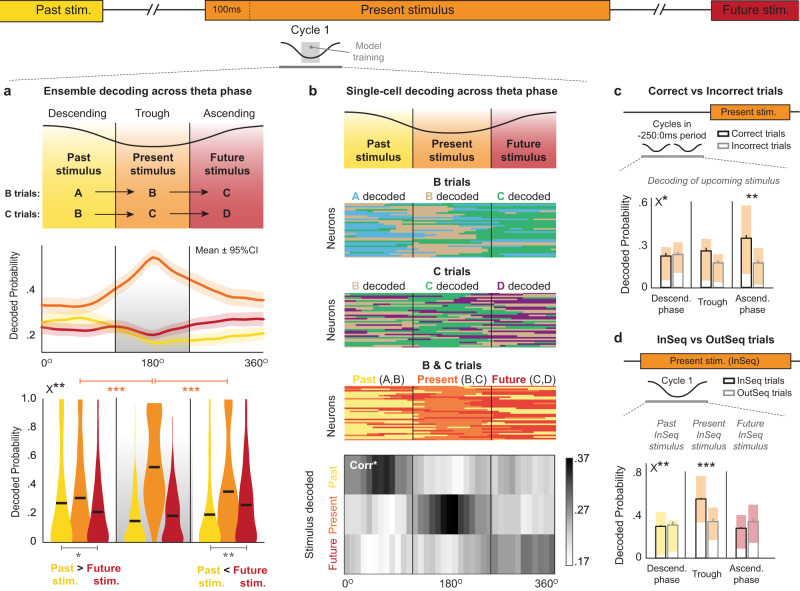
Fig. 5. The representations of past, present and future nonspatial events are sequentially organized within theta cycles and associated with decision accuracy and trial-specific contingencies.
A multinomial logistic regression model was used to quantify odor decoding within theta cycles. a Ensemble decoding during cycle 1 (first cycle beginning 100 ms after port entry). Top, Hypothesized pattern of theta sequence organization. Middle, decoded probability dynamics for past (yellow), present (orange), and future (red) stimuli (n = 295 trials, pooled across odor B & C trials and subjects; mean ± 95% CI). Bottom, The descending phase showed significantly higher decoding of past than of future stimuli, whereas the opposite pattern was found in the ascending phase (phase × stimulus F(1,294) = 12.16, p = 0.0006; tDescending(294) = 2.2098, p = 0.0189; tAscending(294) = 2.8302, p = 0.0025). Decoding of present stimuli was stronger during the trough than either the descending (t(294) = 10.2727; p < 0.0001) or ascending (t(294) = 9.4514; p < 0.0001) phases. Horizontal black lines depict means; gray shading indicates model training period. b Single-cell decoding during cycle 1. Top, hypothesized pattern. Middle three panels, decoding of past, present, and future stimuli in same example neurons across trials of odor B, C, and B & C combined. Color indicates odor with highest z-scored probability per 10° bin (Odor A = sky blue, B = brown, C = green, D = purple). Bottom, Proportion of phase-modulated neurons coding for past, present, and future stimuli in each 10° bin (B & C trials; Corr*, significant stimulus-phase correlation determined by permutations). c Theta sequence information was associated with decision accuracy. Ensemble decoding accuracy of upcoming stimulus was higher on correct (n = 60) than incorrect (n = 30) trials during ascending phase (averaged over two pre-trial cycles; performance × phase F(2,88) = 3.717, p = 0.0282; tAscending(44) = 2.683, Bonferonni-corrected p = 0.0027). d Theta sequence information flexibly reflected trial-specific contingencies. Using decoding of InSeq stimuli as reference, InSeq (n = 297) and OutSeq (n = 30) trials were shown to differ in content during the trough of cycle 1 (capturing the OutSeq nature of trials) but not in the descending and ascending phases (InSeq/OutSeq × phase; F(2,650) = 6.779, p = 0.001; tTrough(325) = 3.819, Bonferroni-corrected p < 0.0001). Bars graphs in c, d depict mean ± SEM (B & C trials, pooled across subjects), with shaded regions reflecting Q1–Q3 range (median as white line). All t-tests two-tailed (*p < 0.05; **p < 0.005; ***p < 0.0001; uncorrected in panel a because defined a priori). X* and X** denote significant ANOVA interactions (p < 0.05 and p < 0.005, respectively).

