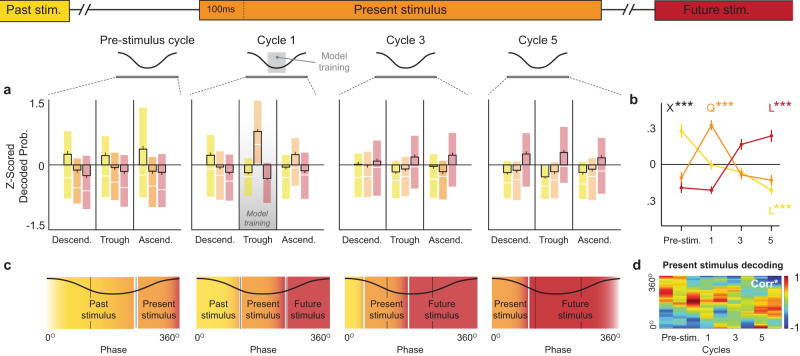
Fig. 6. The representations of nonspatial events display sequential decoding peaks and phase precession across theta cycles.
a, b Ensemble decoding showing sequential peaks of past, present, and future stimulus coding across cycles consistent with sequence reactivation in Fig. 4 (n = 297; B & C trials combined and pooled across rats). a Decoding probabilities across phases and cycles. Past (yellow), present (orange), and future (red) stimulus probabilities were separately z-normalized using their data from all plots to highlight their respective dynamics across phases and cycles. b Summary and quantification of dynamics across cycles shown in a, collapsed across phase. The decoding of past, present, and future stimuli exhibited significantly different distributions across cycles (stimulus × phase F(6,10656) = 64.288, p < 0.0001). Past stimulus decoding decreased across cycles (linear trend F(1,888) = 89.57, p < 0.0001), whereas future stimulus decoding increased (linear trend F(1,888) = 103.5, p < 0.0001), and present stimulus decoding showed a curvilinear relationship peaking in cycle 1 (quadratic trend F(2.888) = 48.34, p < 0.0001). c Hypothesized decoding pattern based on demonstrations of theta phase precession from the place cell literature. d Theta phase precession of present stimulus decoding across cycles. Data shown represents the sum of z-scored decodings of all neurons (n = 251; pooled across animals, normalized to cycle maximum; see “Methods” section). Peak decoding of present stimulus significantly varied in phase across cycles (Corr*; r = −0.377, p = 0.007), from a late (ascending) phase to an early (descending) phase. Data in a, b depict mean ± SEM (B & C trials, pooled across subjects). Shaded regions in a depict Q1–Q3 range (median denoted by white line). L*** and Q*** indicate significant linear and quadratic trends (p < 0.0001). X*** denotes significant interaction by two-way ANOVA (p < 0.0001).

