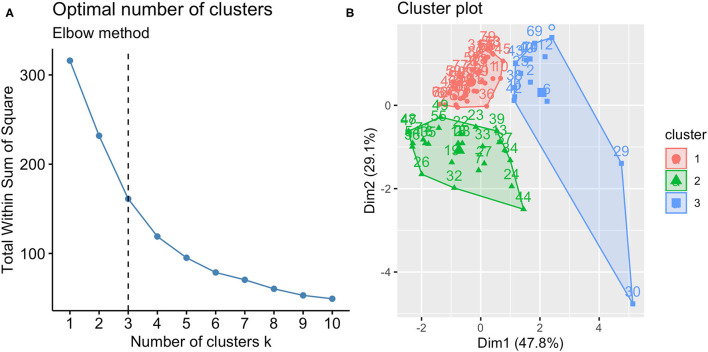
Figure 1.
Optimal number of clusters (A) and cluster plot (B). According to Elbow method, cluster size and interpretability the optimal number of clusters was 3; the clusters identified are reported in the cluster plot in which observations are represented by points, square and triangles using principal components.

