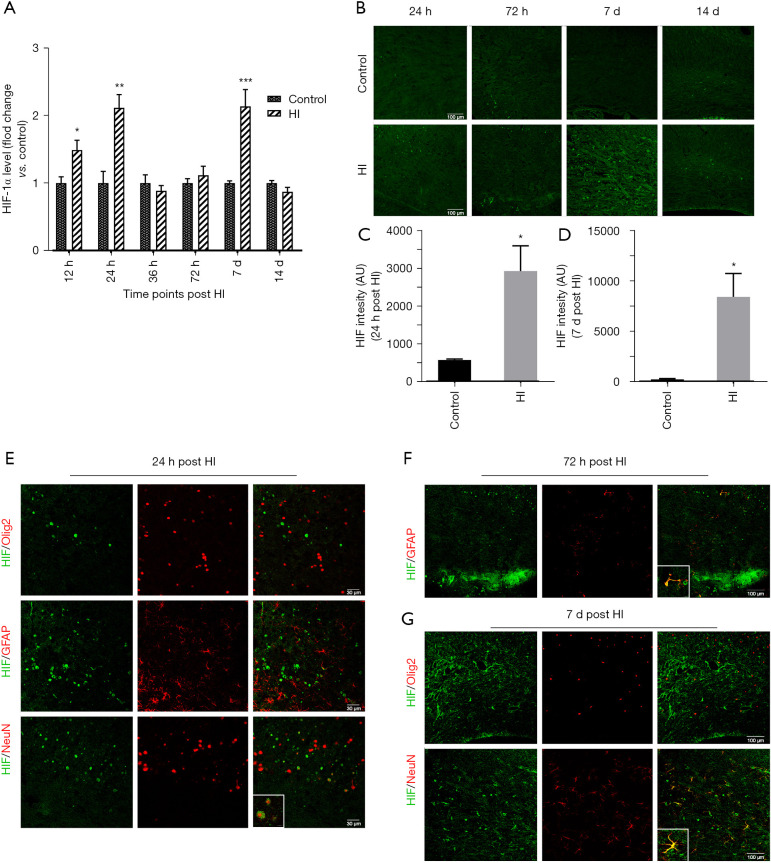
Figure 2.
Temporal pattern of HIF-1α expression in the ipsilateral corpus callosum after HI injury. (A) Western blot quantification of HIF-1α protein in the ipsilateral corpus callosum at different time points post HI injury. n=6–8/group. (B) Representative pictures of immunofluorescence of HIF-1α in the ipsilateral corpus callosum at 24 h, 72 h, 7 d, and 14 d post HI injury. (C,D) Quantification of HIF-1α intensities at 24 h and 7 d post HI injury. (E-G) Representative pictures of immunofluorescence stained with anti-HIF-1α (green) and anti-Olig2 (red), anti-GFAP (red) or anti-NeuN (red) antibodies in the ipsilateral corpus callosum at 24 h, 72 h, and 7 d post HI injury. Scale bars in (B): 100 µm; in (E): main images, 30 µm, insets 5 µm; in (F) and (G): main images, 100 µm, insets, 10 µm; n=3–4/group. Values were shown as mean ± SEM; *, P<0.05; **, P<0.01; ***, P<0.001 by t-test.

