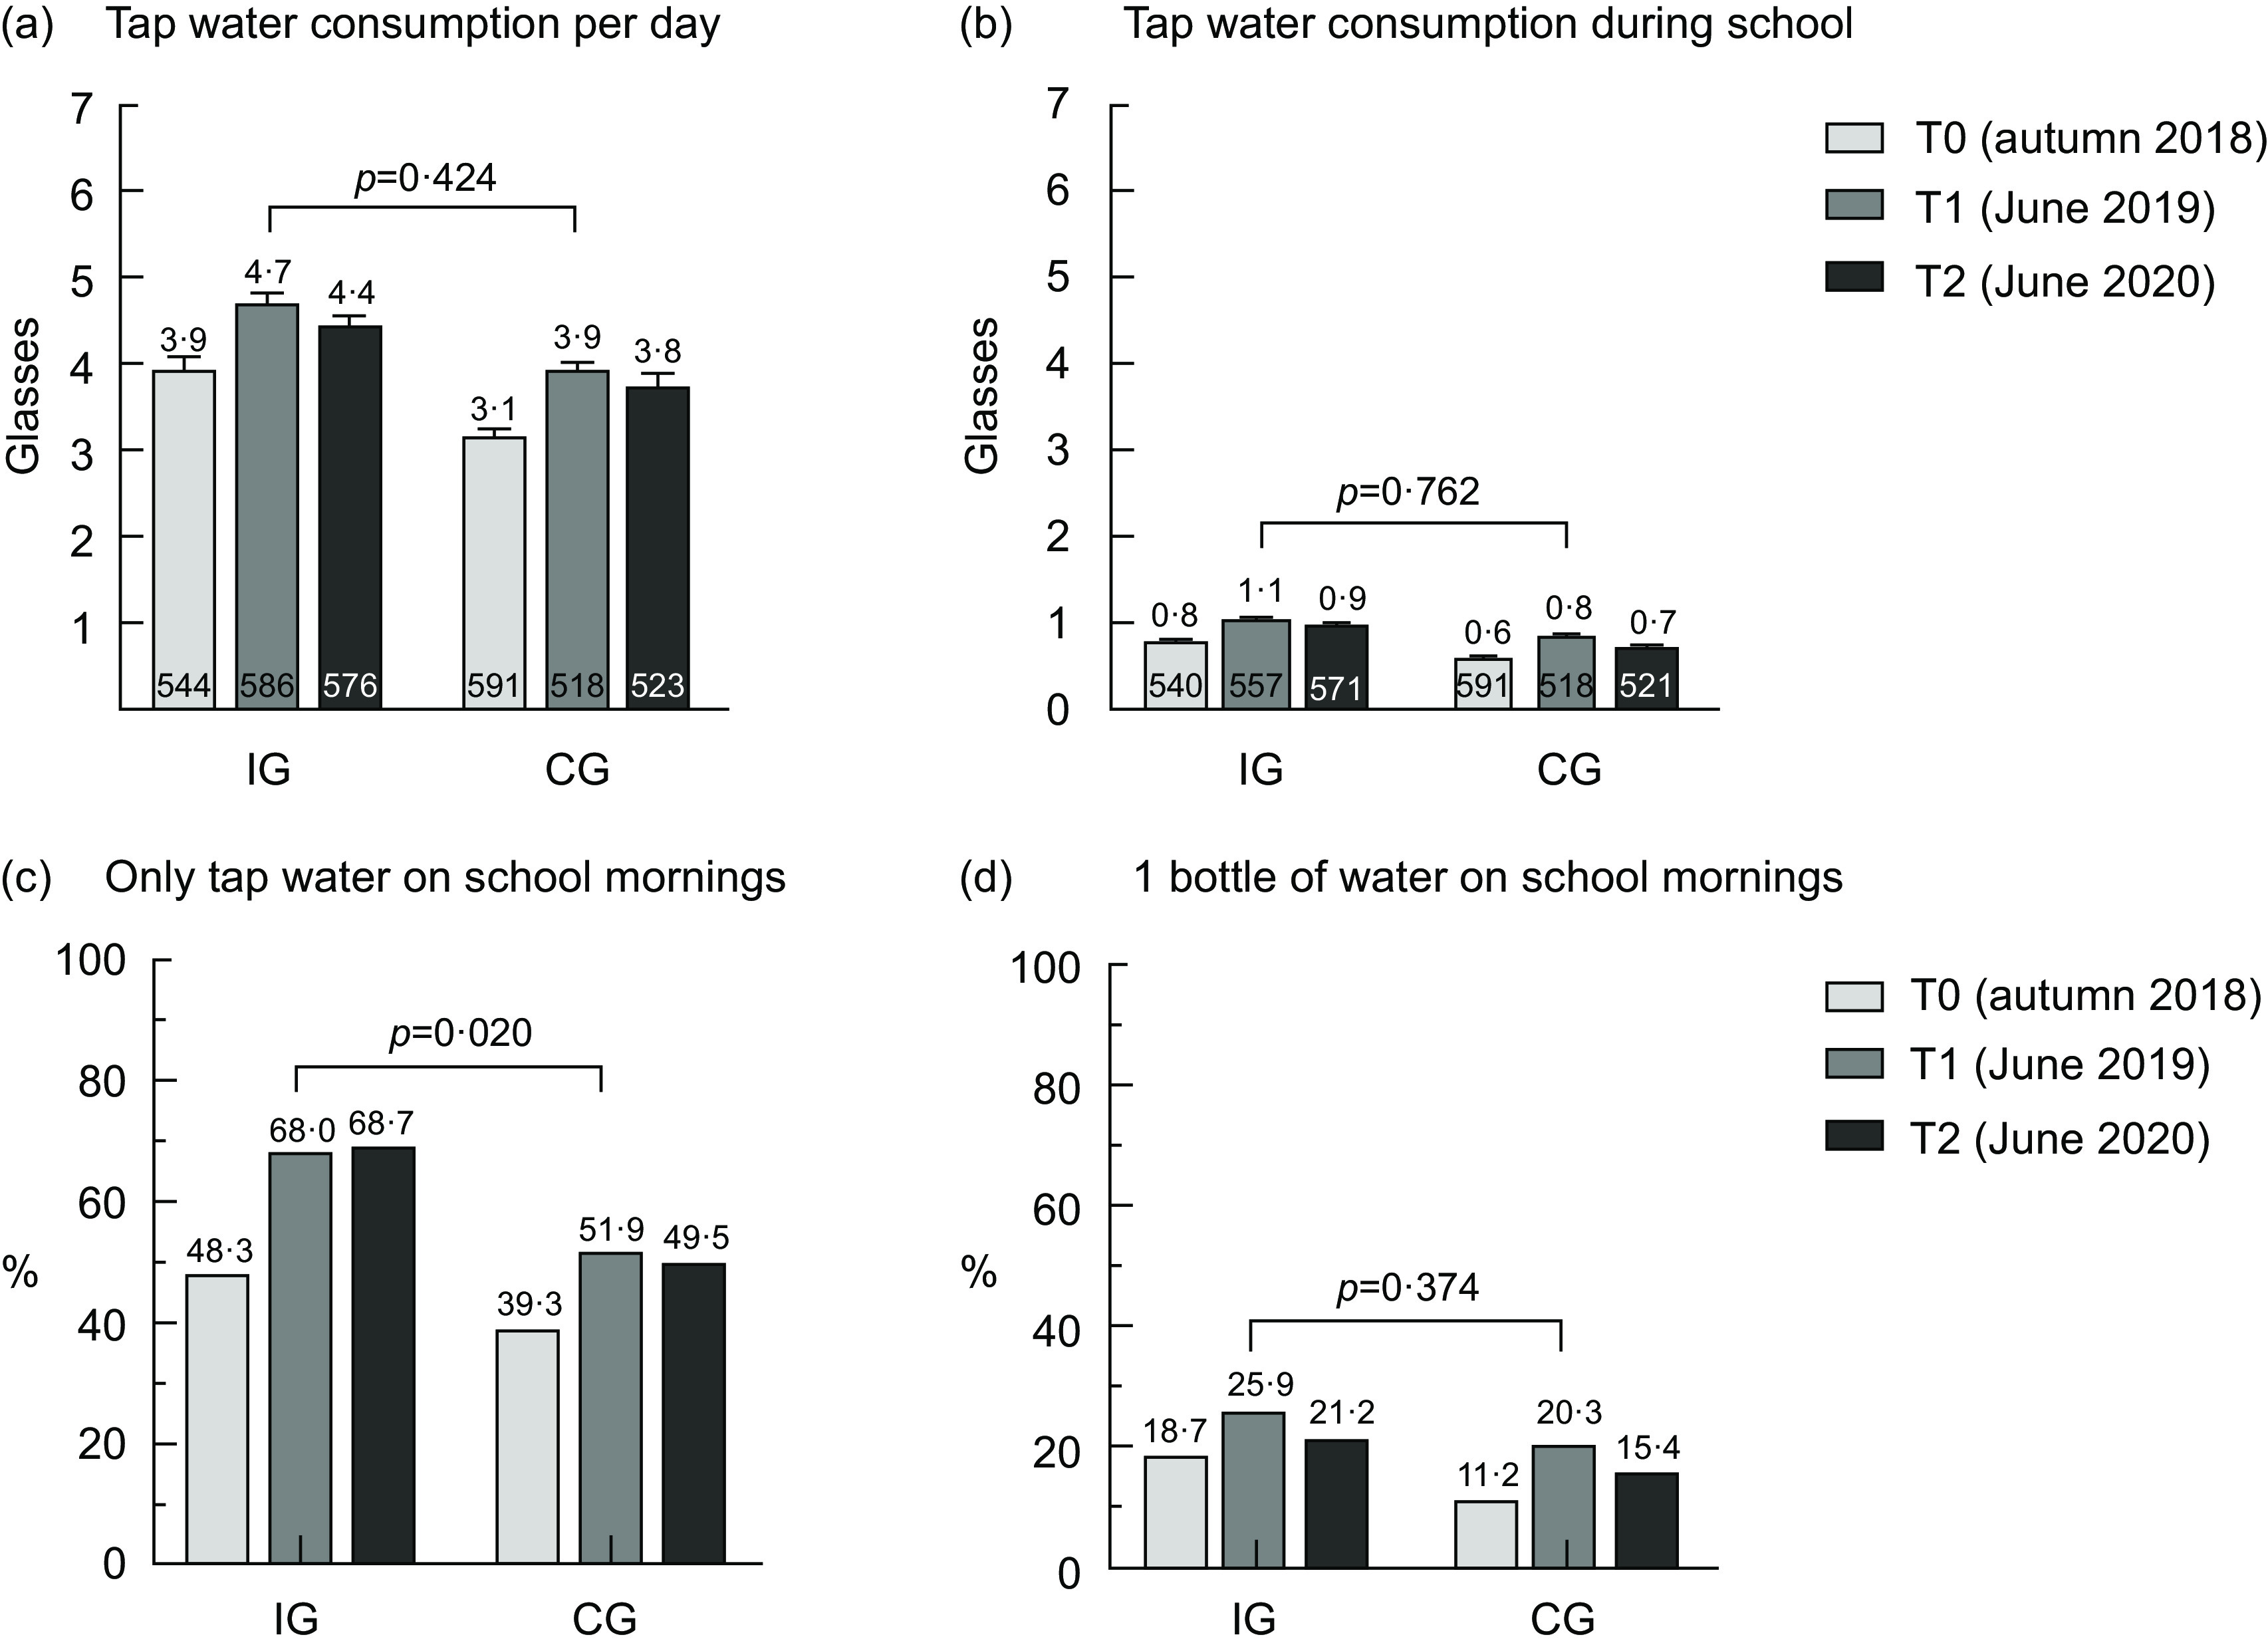
Fig. 2.

Beverage consumption among schoolchildren over time in the IG and CG. IG, intervention group; CG, control group; T0, baseline; T1, after the intervention at 9 months; T2, 1-year follow-up after the intervention; the numbers in the bottom of Fig. 2(a) and (b) denote the number of pupils; values are means and standard error of the mean; P-values for the difference in the time trends between the IG and CG account for the cluster effect on the class level
