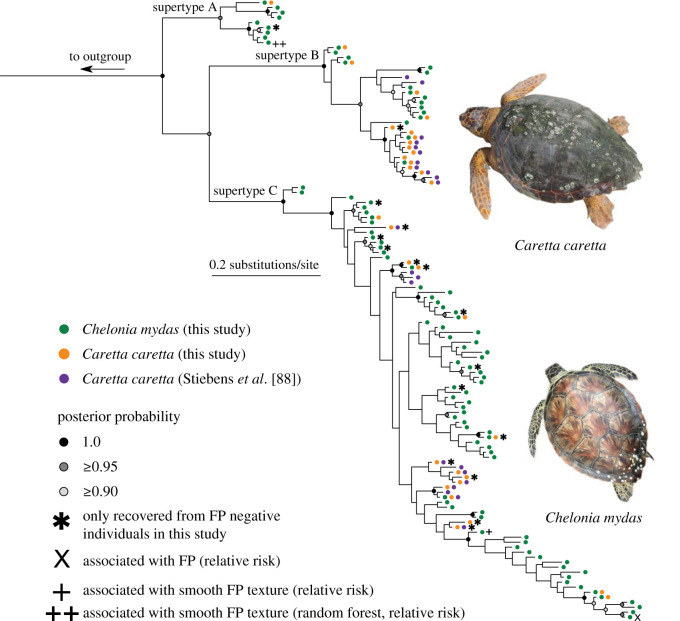
Figure 2.
Bayesian phylogeny of 124 alleles of exon 2 (162 bp) of the Iα MHC in Ch. mydas and Ca. caretta (116 of which were recovered from turtles sampled in this study from the central Florida Atlantic coast). Posterior probabilities greater than 0.90 are shown and supertype group membership is denoted on interior branch. Asterisk denotes alleles recovered in FP negative turtles. ‘X’ denotes alleles significantly with FP in relative risk analysis. Single cross symbol denotes alleles associated with smooth tumour texture per relative risk analysis; double cross symbol denotes alleles associated with smooth tumour texture per random forest modelling and relative risk analysis.

