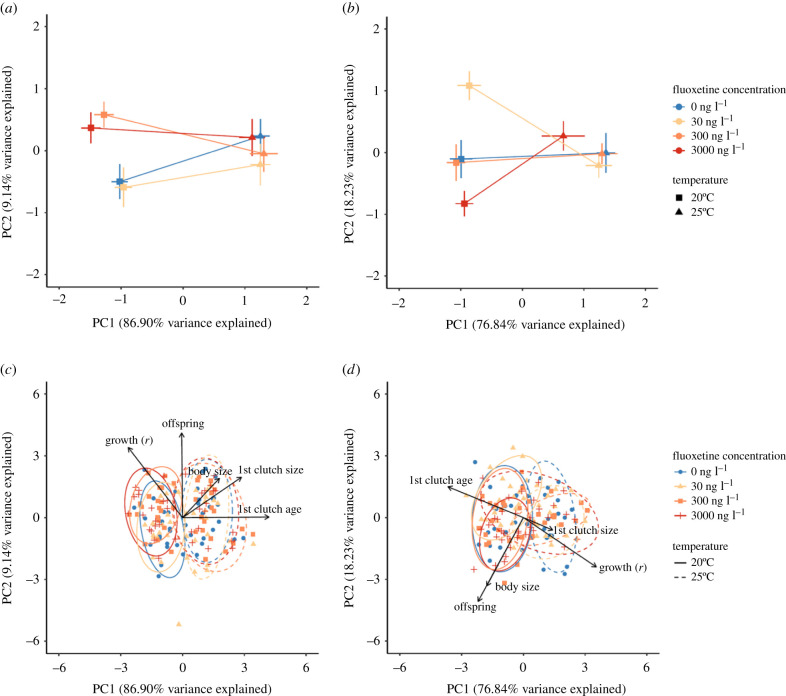
Figure 2.
Principal component plots depicting: (a) phenotype trajectories of HO2 genotype Daphnia magna in response to temperature and fluoxetine treatments, (b) phenotype trajectories of M10 genotype Daphnia. (c) All observations for HO2 Daphnia grouped according to temperature and fluoxetine treatments and (d) all observations for M10 Daphnia grouped according to temperature and fluoxetine treatments. Contributions of each life-history trait (first clutch age, first clutch size, offspring, body size and intrinsic growth) toward the PC1 and PC2 axis for each genotype are shown (c,d). Ellipses represent 95% confidence bands. (Online version in colour.)

