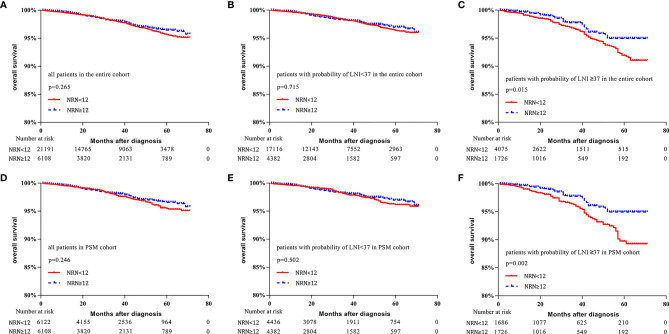
Figure 3.
Kaplan–Meier curves of overall survival for patients in the entire cohort (A), patients with lymph node invasion (LNI) probability <37 in the entire cohort (B), patients with LNI probability ≥37 in the entire cohort (C), all patients in the propensity-score matched (PSM) cohort (D), patients with LNI probability <37 in the PSM cohort (E), and patients with probability of LNI ≥37 in the PSM cohort (F). Patients were stratified according to the number of removed nodes (NRN ≥12 vs. NRN <12).

