
Figure 6.
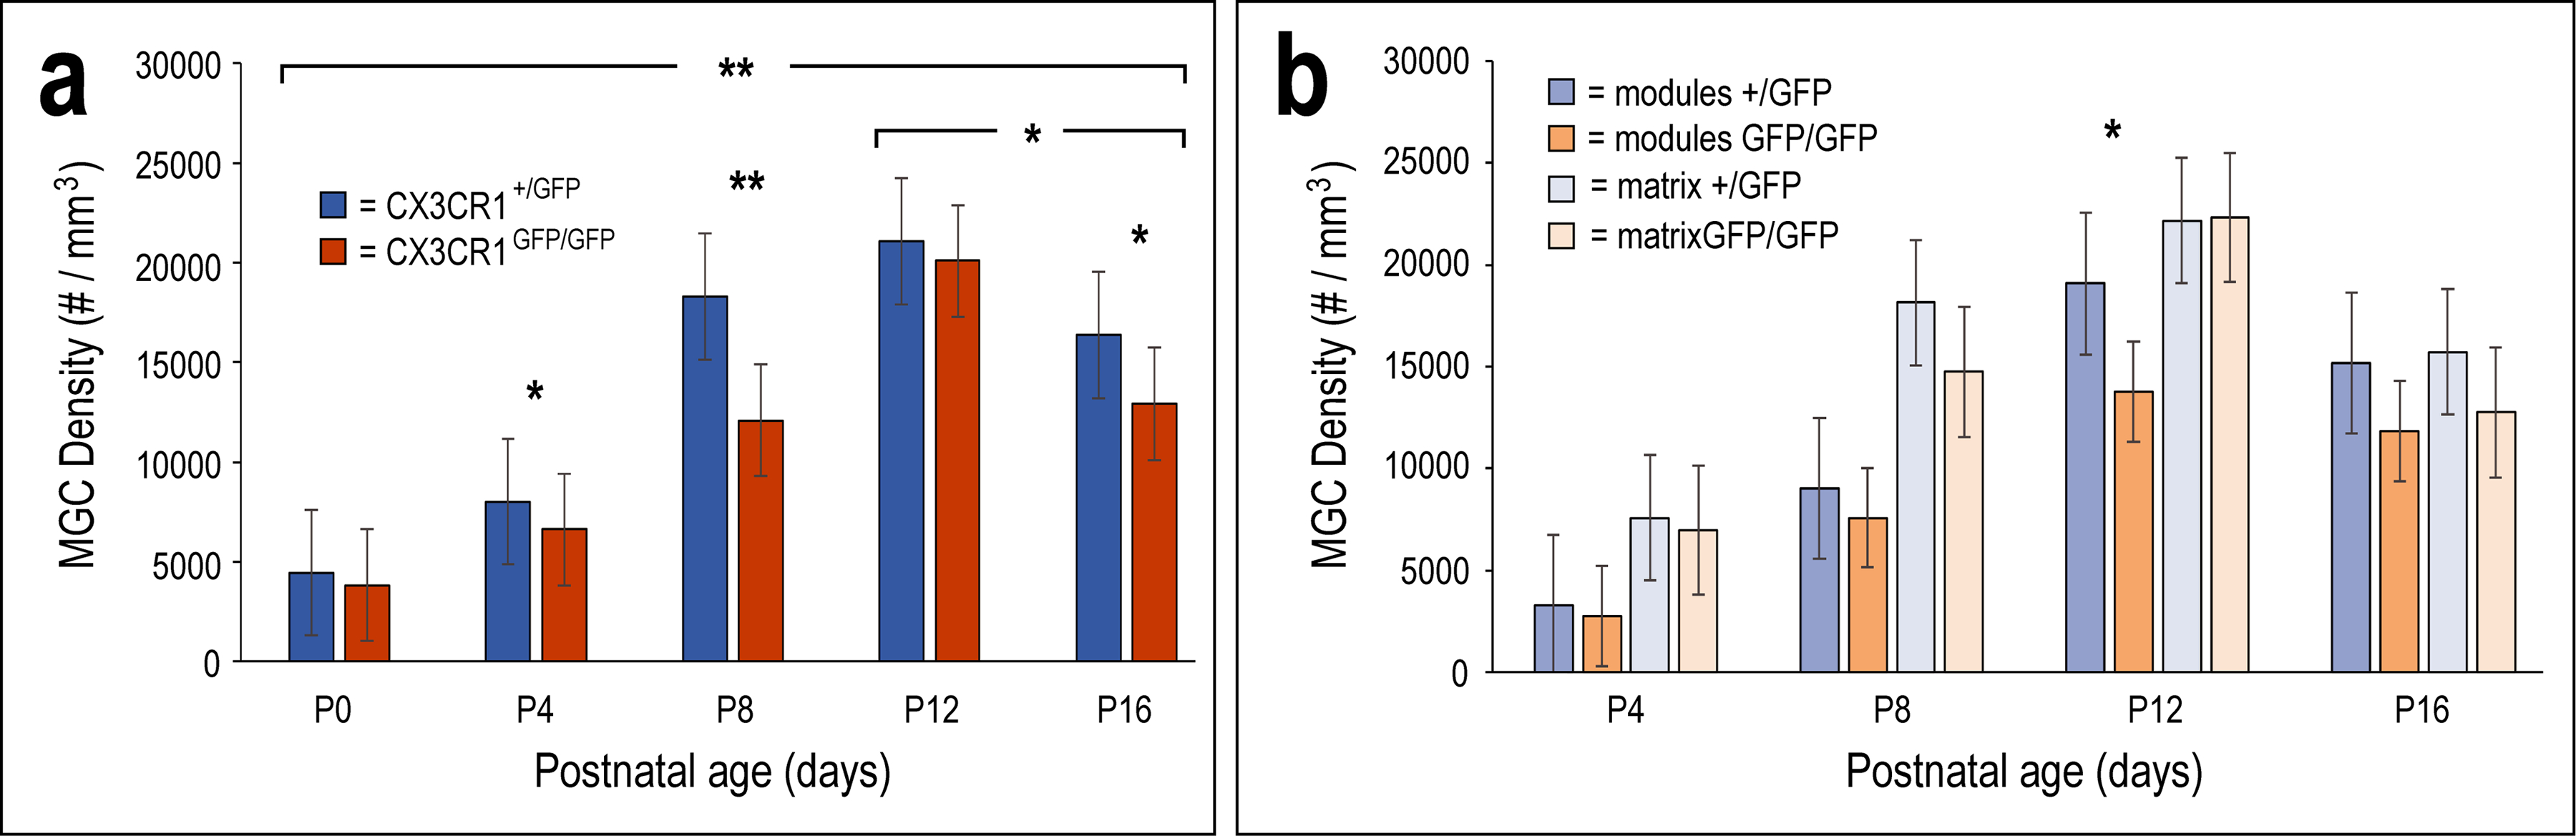
Quantification of MGC density in the LCIC by postnatal age/genotype (a) as well as cell location (modular vs. matrix, b). MGC density significantly increases in the LCIC up to P12 (hearing onset), before significantly dropping by P16 in both CX3CR1+/GFP and CX3CR1GFP/GFP mice. With compromised fractalkine signaling, significantly fewer MGCs are present in the LCIC at P4, P8, and P16 compared to CX3CR1+/GFP littermates (a; * = p < 0.01, ** = p < 0.001). Fractalkine-mediated MGC recruitment from the surrounding matrix into modular zones is delayed in CX3CR1GFP/GFP mice, as significantly less MGCs occupy LCIC modules at P12 (b; * = p < 0.05). Restricted migration is short-lived, however, as MGC density within modules is comparable to that of heterozygous littermates by P16. P0 was not assessed for relative MGC location (modular vs. matrix) in (b) as modules do not become evident until P4. A total of n = 30 mice were included in the quantitative measures. Multiple animals were used at each age (n = 3) for each of the two genotypes (i.e. n = 6 total mice at each age). For each mouse at least 3 sections were sampled to include anatomical variability at different caudorostral levels of the LCIC. Thus, a minimum of 9 sections from a minimum of 3 animals were included for each analytical category. Error bars depict standard deviations.