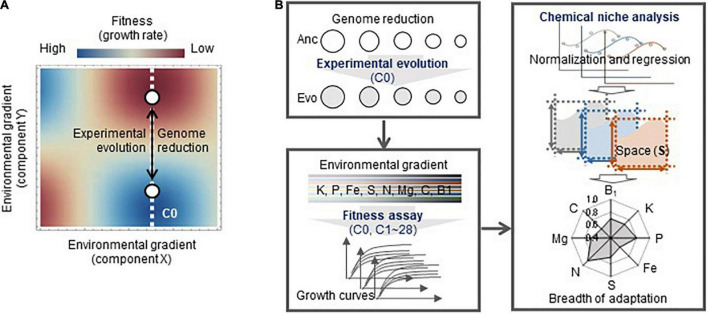
FIGURE 1.
Conceptual illustration of the study. (A) Fitness landscapes of the reduced genomes in the environmental gradient. The evolution of the genomes (open circles), from Anc to Evo, leads to not only adaptation to the environment for evolution (C0, white broken line) but also correlated adaptation to the environmental gradient. The color gradation from red to blue indicates the fitness from high to low. (B) Overview of the experiments and analyses performed in the present study. The experimental and analytical studies are categorized in three boxes, which are the experimental evolution, high-throughput fitness assay, and chemical niche analysis. Five genomes (strains) used for the evolution are shown as circles. The eight elements investigated in the chemical niche analysis are indicated.

