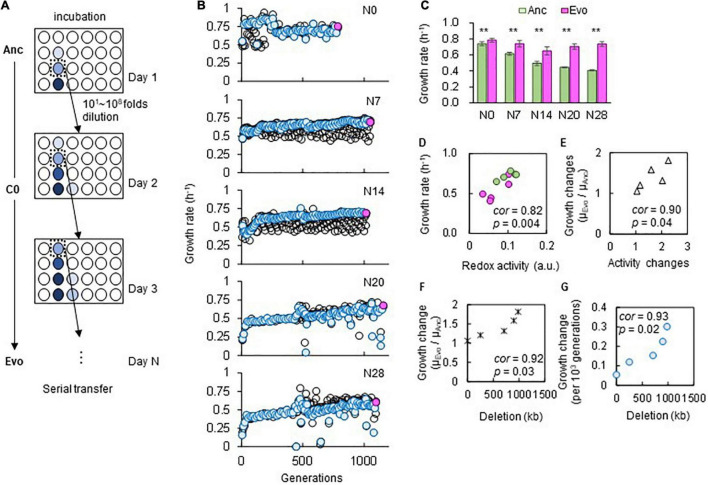
FIGURE 2.
Experimental evolution for adaptation to C0. (A) Illustration of experimental evolution. The gradation from light to dark blue indicates the cell concentration from low to high. The E. coli cells were cultured in eight wells, and eight 10-fold serial dilutions were prepared. Only one of the eight wells (dilutions) showing growth in the early exponential phase was used for serial transfer, as indicated by dotted boxes. (B) Temporal changes in growth rates during the experimental evolution. The five genomes are indicated. The blue circles represent the lineages adopted for the following serial transfer, corresponding to the wells indicated by dotted boxes in (A). The black circles stand for the remaining serial dilutions (i.e., the other seven wells) that were not adopted for serial transfer. The endpoint populations of the evolutionary lineages (blue circles) used for the following analyses are indicated in pink. (C) Growth rates in the medium for evolution. Green and pink bars represent the growth rates of Ancs and Evos in C0, respectively. Standard errors of biological replications (N > 6) are indicated. Asterisks indicate the statistical significance of the two-tailed Student’s t-test (p < 0.01). (D,E) Correlation between the growth rate and cellular redox activity. Green and pink circles represent Ancs and Evos, respectively. The Spearman rank correlation coefficients and statistical significance are indicated. (F) Correlation between the changes in growth rate and genome reduction. The lengths of the genomic deletions are plotted against the ratio of the growth rates of Ancs and Evos. The Spearman rank correlation coefficients and statistical significance are indicated. (G) Correlation between the changes in growth rate per generation and genome reduction. The Spearman rank correlation coefficients and statistical significance are indicated.

