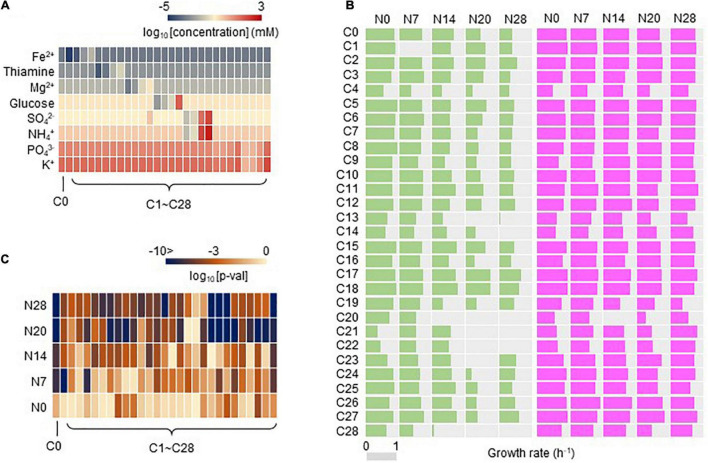
FIGURE 3.
Growth rates evaluated in 29 medium combinations. (A) Heatmap of the concentration gradient. The eight chemical components of the media are indicated. The gradation from red to blue indicates the concentration, which is shown on the logarithmic scale, from high to low. C0 is the environment for evolution. (B) Growth rates of Ancs and Evos in the environmental gradient. The growth rates evaluated in the 29 medium combinations are shown. Pink and green represent Evos and Ancs, respectively. The gray bar represents the scale of the exact growth rate (h– 1). (C) Heatmap of statistical significance of the changes in growth rate of Evos and Ancs. The gradation from light orange to dark blue indicates the p-value, which is shown on the logarithmic scale, from low to high.

