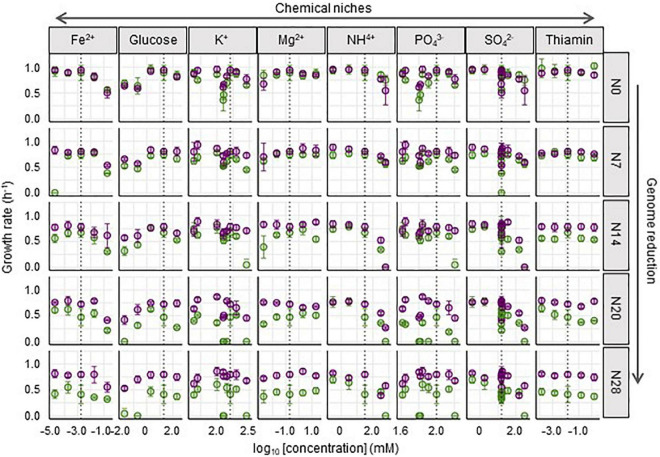
FIGURE 4.
Fitness across the concentration gradient of individual chemical niches. The mean growth rates in the 29 medium combinations are shown. The concentrations of chemical niches are shown on a logarithmic scale. The wild-type and reduced genomes are indicated as N0 and N7∼N28, respectively. Purple and green represent Evos and Ancs, respectively. Standard errors of biological replications (N > 6) are indicated.

