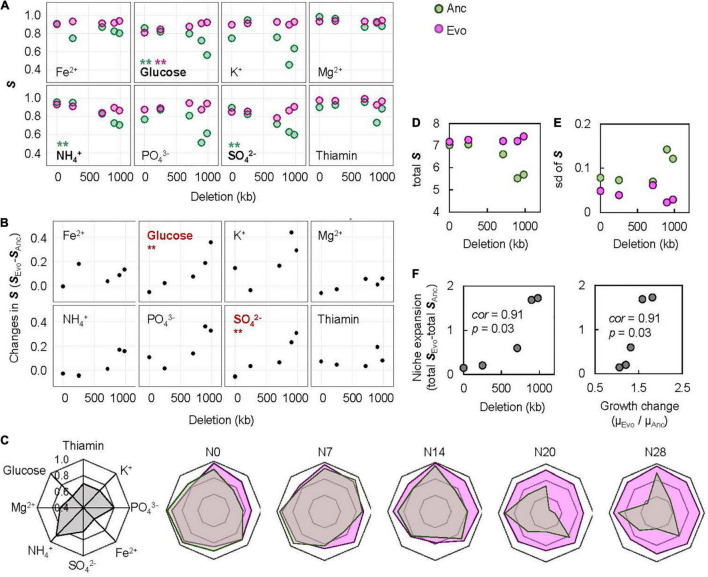
FIGURE 5.
Evaluation of the breadth of adaptation. (A) Relationships between the S and genome reduction. The chemical niches and the statistical significance of the Spearman rank correlation are indicated. Boldfaces associated with asterisks represent statistical significance (**p < 0.01). Pink and green represent Evo and Anc, respectively. (B) Relationships between the changes in S and genome reduction. The chemical niches and the statistical significance of the Spearman rank correlation are indicated. Boldfaces in red associated with asterisks represent statistical significance (**p < 0.01). (C) Radar chart of the eight niche spaces. The eight chemical niches and the scale of S are illustrated in the monotone radar chart. The five genomes are shown separately. Transparent pink and green represent Evos and Ancs, respectively. (D) Sum of the eight S. (E) Standard deviation of the eight S. (F) Correlation of the changes in total S to genome reduction and direct adaptation. The Spearman rank correlation coefficients and statistical significance are indicated.

