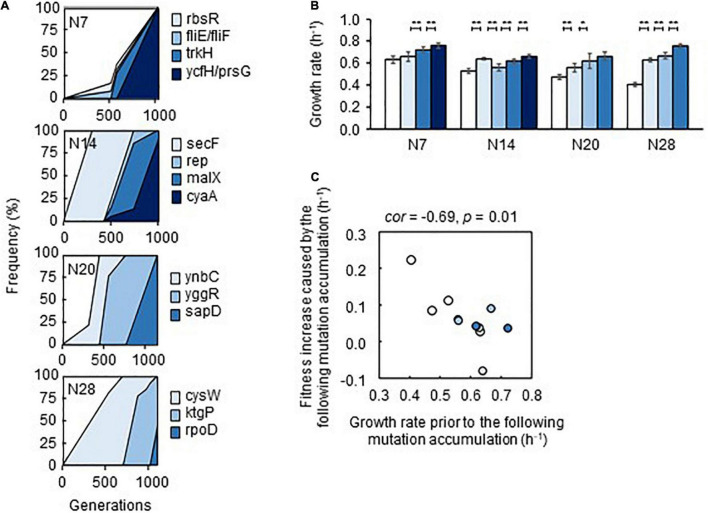
FIGURE 6.
Fitness increase attributed to the mutations. (A) Stepwise accumulation of genome mutations. Mutation during the evolution. The temporal changes in the mutations fixed during the evolution are shown. The four reduced genomes and the gene names of mutants are indicated. (B) Additive increase in the growth rates of the mutants in the medium for evolution. Gradation from white to dark blue indicates the mutants with respect to those shown in (A). Standard errors of biological replications (n > 6) are indicated. Asterisks indicate the statistical significance of the two-tailed Student’s t-test (*p < 0.05; **p < 0.01). (C) Correlation between mutation accumulation and changes in growth rates. A total of 12 mutants of a single accumulated mutation are shown. The Spearman rank correlation coefficients and statistical significance are indicated.

