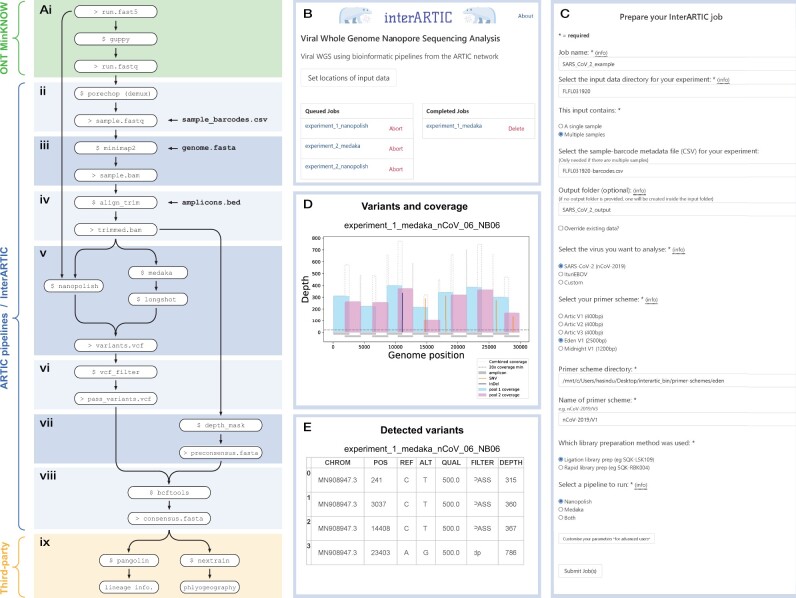
Fig. 1.
Overview of the InterARTIC workflow and graphical interface. (A) Schematic summary of a typical workflow for the analysis of ONT viral genome-sequencing data. Workflow steps (ii–viii) (blue) are performed within ARTIC command line tools or carried out by InterARTIC. (B) Example screenshot of the InterARTIC interface hompage, with queued and completed jobs displayed. (C) Example of the project setup page within the interface, where the user may customize their workflow. Note: full parameter selection options for advanced users are hidden. (D) Example of a coverage profile plot for SARS-CoV-2 that is generated and displayed by InterARTIC. (E) Example of the variant detection table that is generated and displayed

