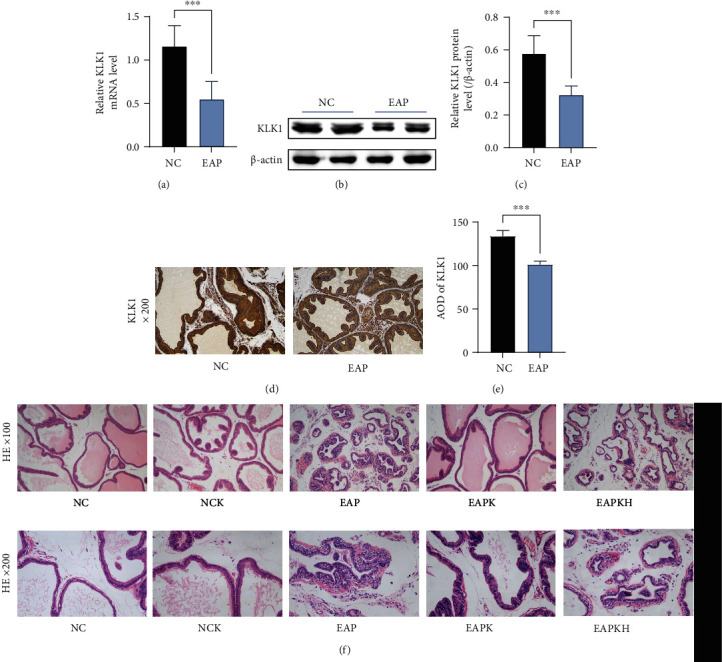
Figure 2.

Suppressed expression of KLK1 in the prostate with inflammation and the conventional pathological manifestations of rat prostates. (a) The relative mRNA expression level of KLK1 to β-actin by QRT-PCR. (b) Representative western blot results of KLK1 protein expression. β-Actin served as an internal control. (c) The relative optical density quantification of KLK1 according to western blot. (d) KLK1 protein expression and location in the prostate by IHC (magnification ×200). (e) The AOD quantification of KLK1 according to IHC. Each bar in (c), (d), and (e) represents the mean ± SD. ∗∗∗P < 0.001; ∗∗∗∗P < 0.0001. (f) Representative H&E photos of the prostate samples of the rats (upper, magnification ×100; lower, magnification ×200).
